2. Basics of optics
2.1 Characteristics of satellites
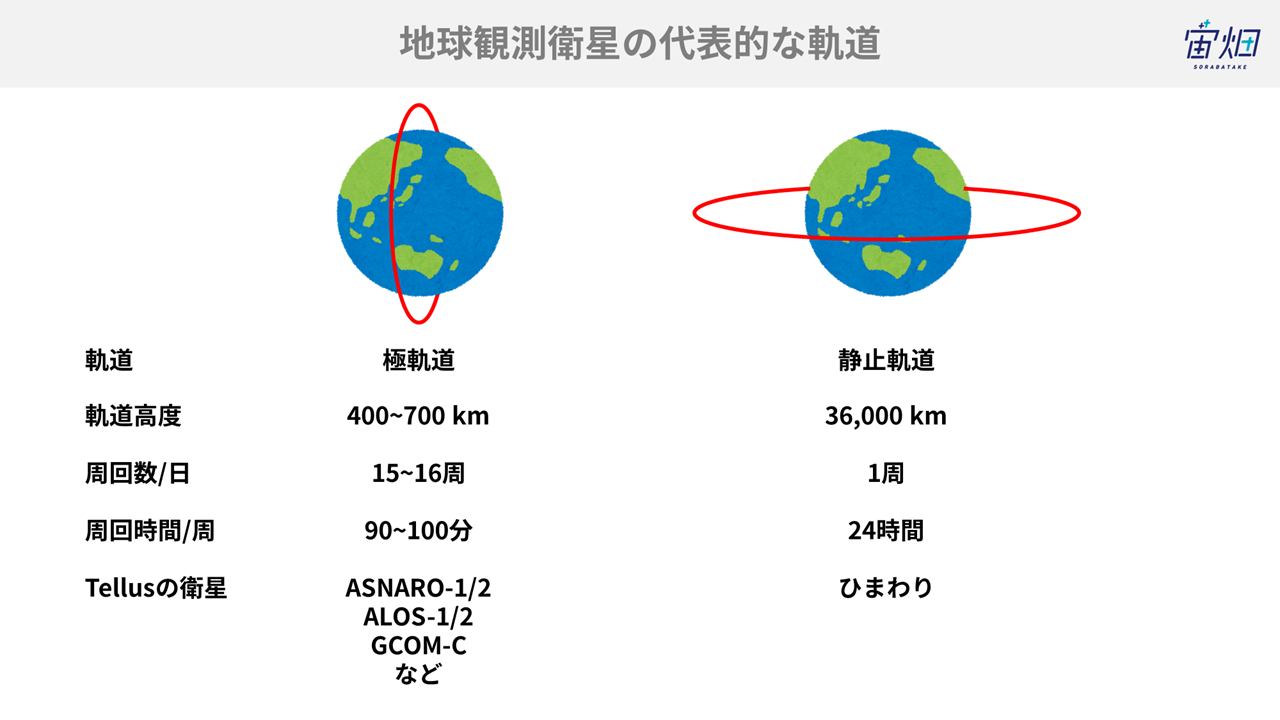
The representative orbits*1 of earth observation satellites are polar and stationary ones. Polar orbits run around the North and South Poles, while stationary orbits run above the equator.
In the case of polar orbits, most satellites circle the earth in 90-100 minutes, so they cannot keep observing the same area. Polar orbit satellites go around the earth 15-16 times per day, although this varies among satellites. This does not mean that they can observe the same area 15-16 times a day. A satellite can observe the same area only once per week or per month. The frequency of observation is represented by the term “recurrent period.” In recent years, the endeavor to increase observation frequency by launching multiple satellites of the same type (which is called Constellation) has been conducted, and it is becoming possible to observe the same spot every day.
Meanwhile, stationary satellites can keep observing the same spot. Accordingly, the meteorological satellite Himawari, which is a representative stationary satellite, can keep delivering meteorological information to use 24 hours a day.
*1: The path of a satellite. Basically, artificial satellites keep going through the same path. However, the earth is rotating, so observation areas change every time. For details, see this footage.
Nagoya City Science Museum, Cast light on the earth from space-Gaze of an earth observation satellite
https://www.youtube.com/watch?v=MJb-nCeGljI&feature=youtu.be
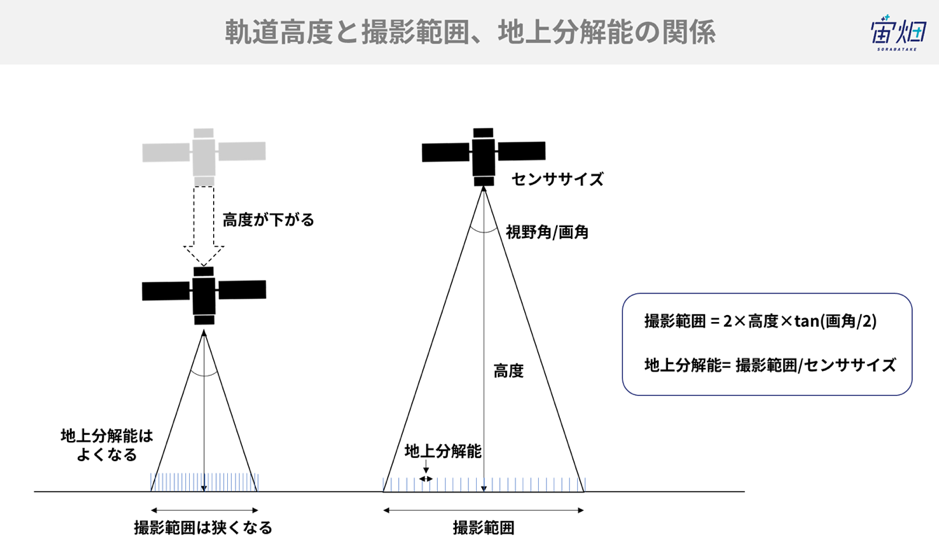
Some may think that we just have to put all satellites into stationary orbits for constant observation. As the orbit altitude is higher or the distance between the ground and a satellite is longer, a broader field of view can be secured, so observation range broadens. This is just like you can have a wider view by distancing your face from an object. When observation range broadens, the frequency of observation of the same spot improves. However, when orbit altitude increases, the resolution of observation degrades. This is just like characters become difficult to read when the distance between your face and notebook increases. This does not mean that we just have to decrease altitude. If orbit altitude is too low, it will decrease gradually due to the atmosphere of the earth. Accordingly, orbit altitude is often set at over 400 km.
For some satellites, we want to increase observation frequency, while sacrificing observation resolution. For some other satellites, we want to increase observation resolution, while sacrificing observation frequency. Orbit altitude and other elements*2 are determined according to observation targets.
*2: The orbit of a satellite can be determined by fixing 6 elements. These are called 6 orbital elements. Representative ones are orbit altitude (orbital radius) and orbit inclination (angle between the equatorial plane and the orbital plane (where a satellite goes around)).
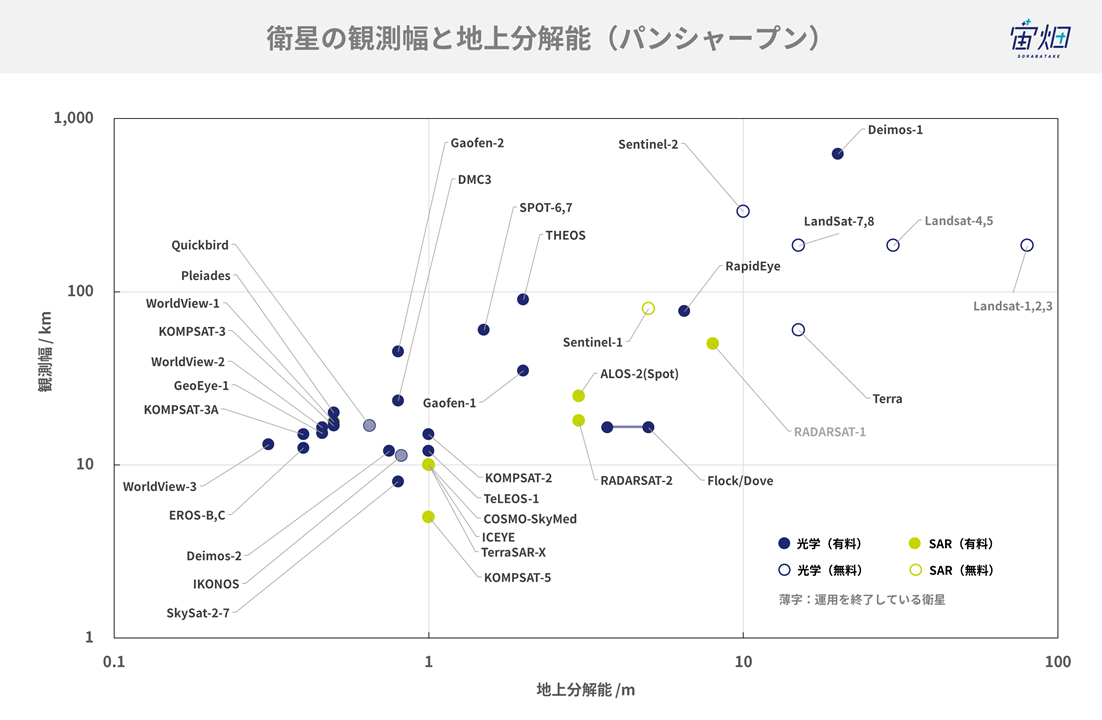
The relations between the resolution and observation range of satellites under operation can be summarized as shown in the figure below. It is obvious that satellites with a higher resolution have a narrower observation range.
2.2 Observation sensors
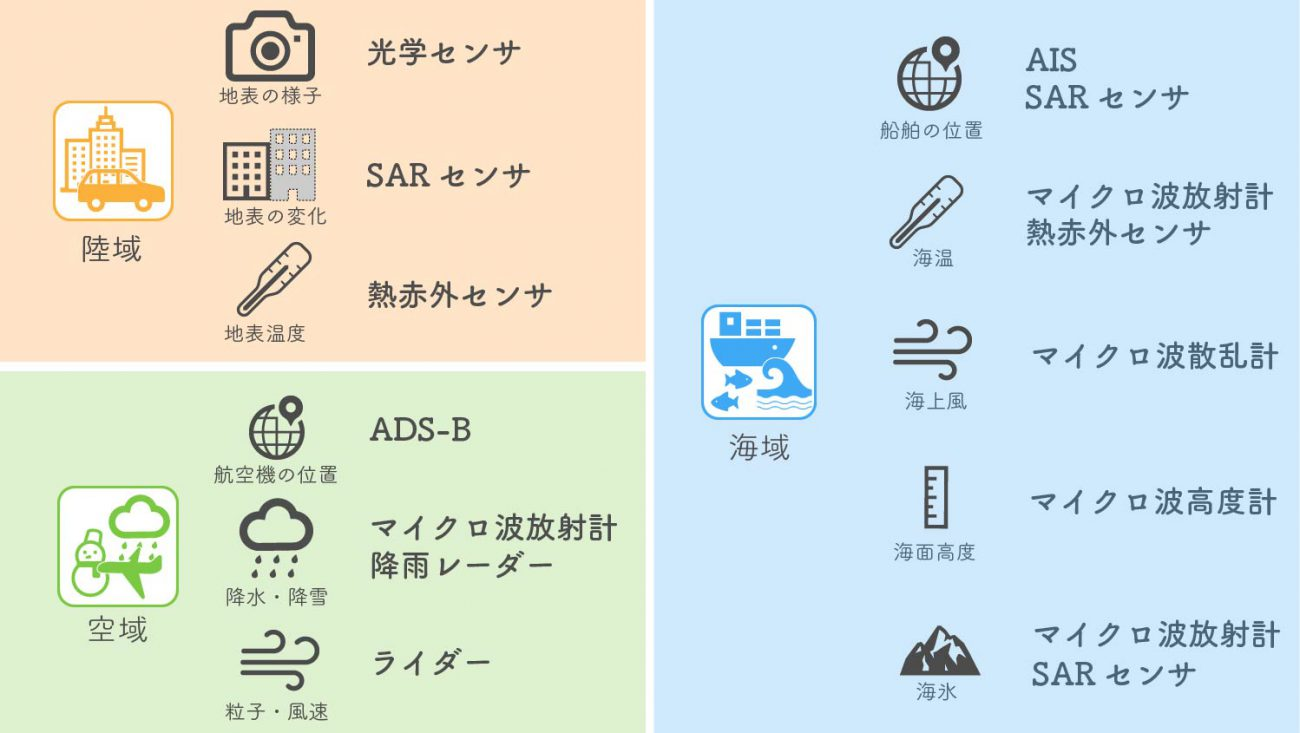
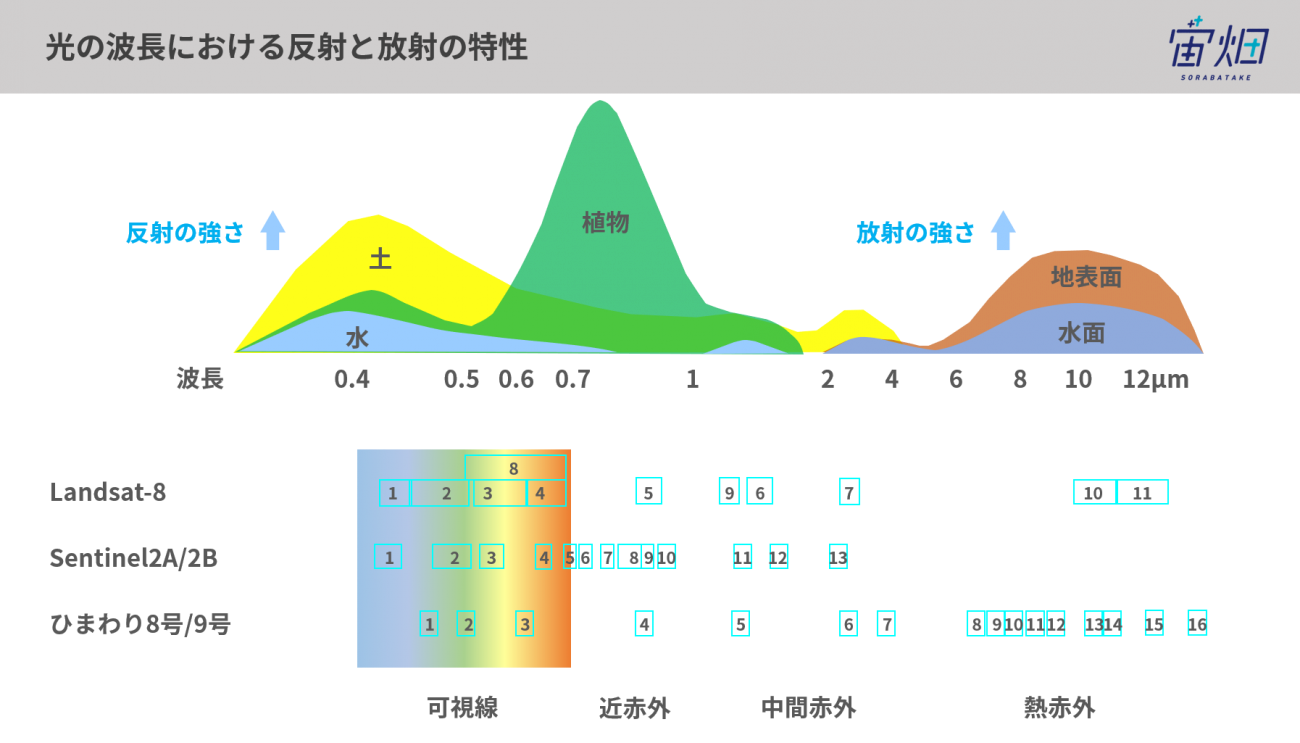
Satellites observe not only land, but also the sea and airspace. The sensors of satellites can be roughly classified into optical sensors for observing the reflected sunlight, SAR sensors for the reflected radio waves emitted by satellites, and radiometers for observing electromagnetic waves from the ground.
As shown in the figure below, each material has characteristics of reflection or radiation. By observing objects in each wavelength range, it is possible to infer the states of objects.
2.3 Parameters of satellite images
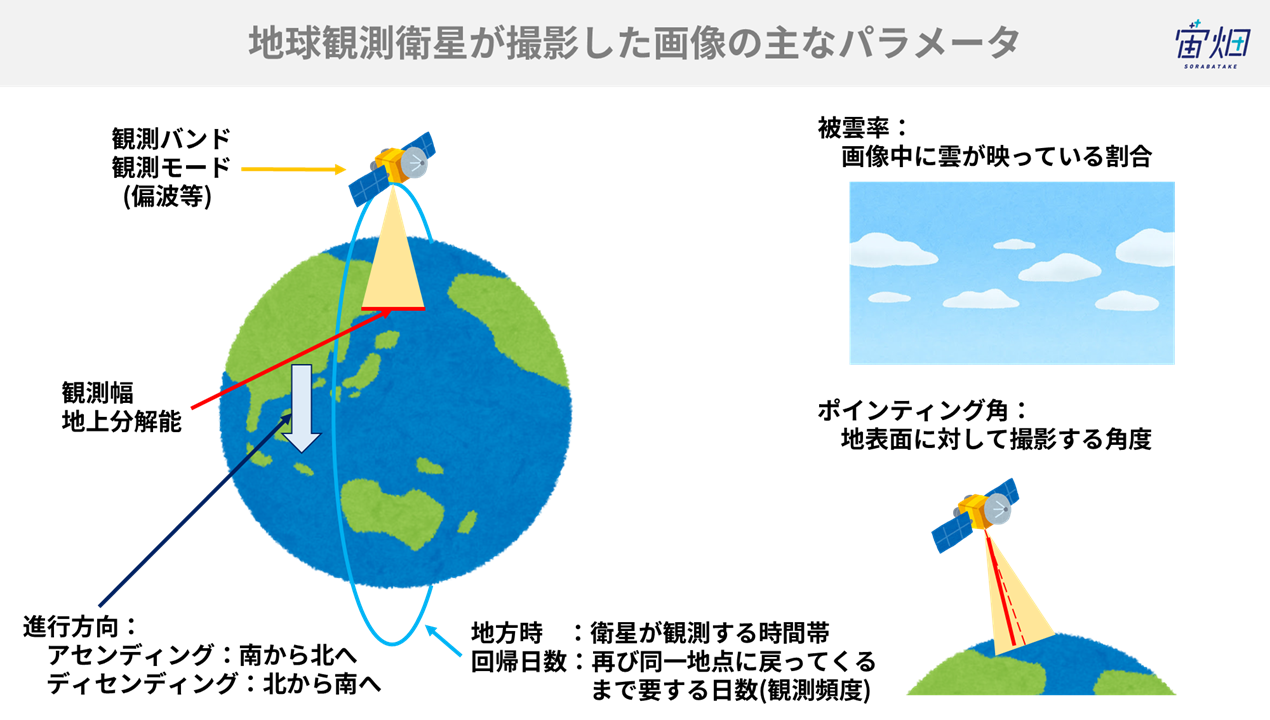
The main parameters of satellite images are as shown in the figure below. Observation range and ground resolution vary according to observation mode, and how taken images are displayed according to pointing angle
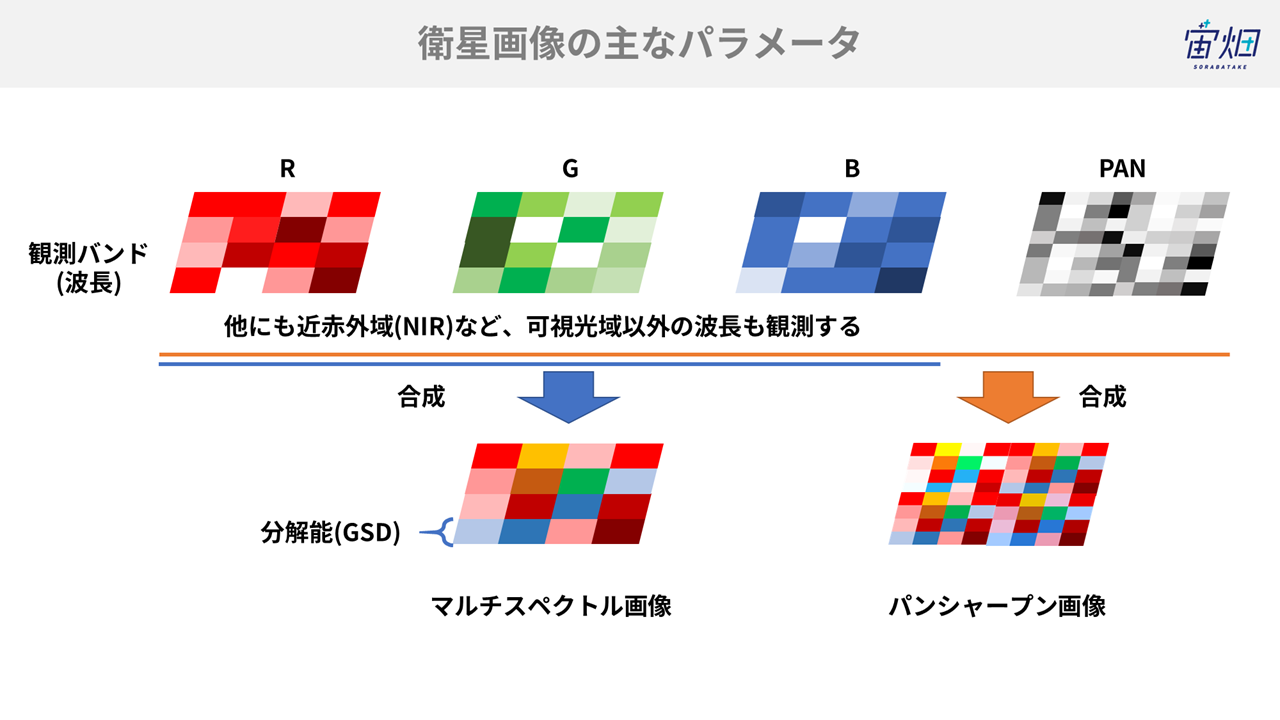
Especially, the parameters related to images are shown in the figure below. The band represents a frequency band to be observed, and images are produced by combining the pictures in different bands. Most satellites take pictures in the gray scale called the “panchromatic” and in wavelength ranges, such as the visual light range and the infrared range, called the “multispectral.” Panchromatic images are in the gray scale, but high-resolution compared with multispectral ones. A method of combining the strong points of the two kinds of images and producing high-resolution colored images is pan-sharpening, which combines panchromatic and multispectral images.
Ground sample distance (GSD) is an indicator of the size of an object covered by a single pixel. The highest resolution among currently used private satellites is 0.3 mGSD.
2.4 Characteristics for each wavelength
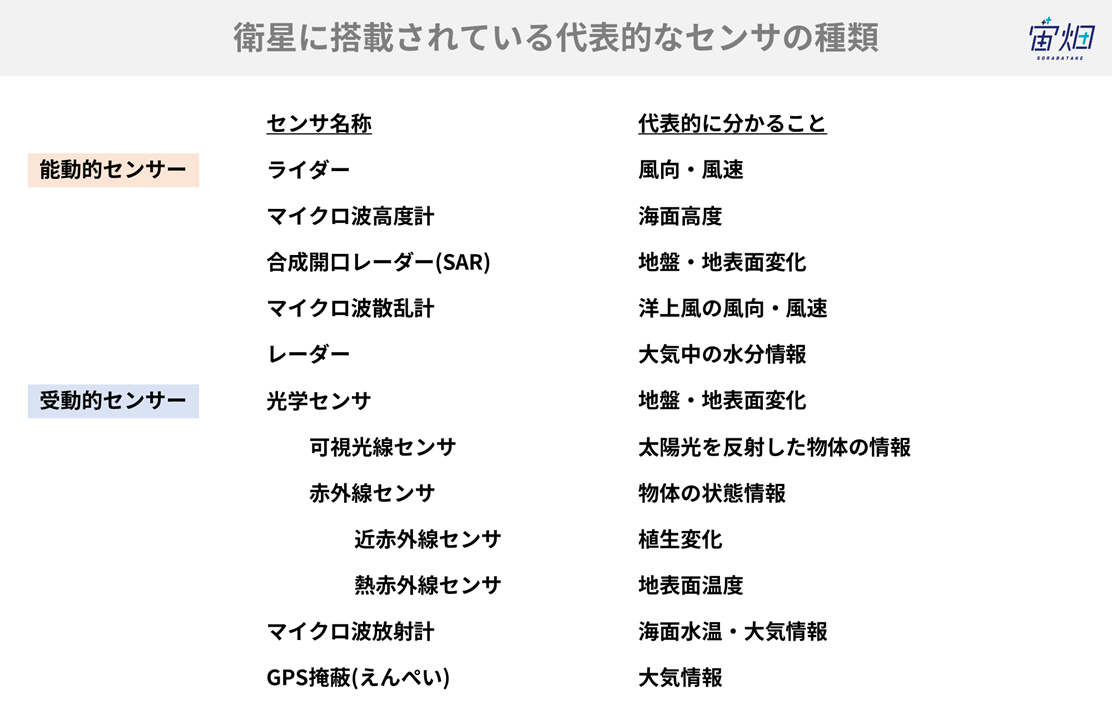
Each satellite is mounted with various sensors, and there are many observation methods.
The sensors can be roughly classified into:
- Active sensors for observing reflected radio waves, etc. emitted by a satellite itself
- Passive sensors for observing reflected sunlight and electromagnetic waves emitted by objects
Let’s see each observation method and their merits and problems.
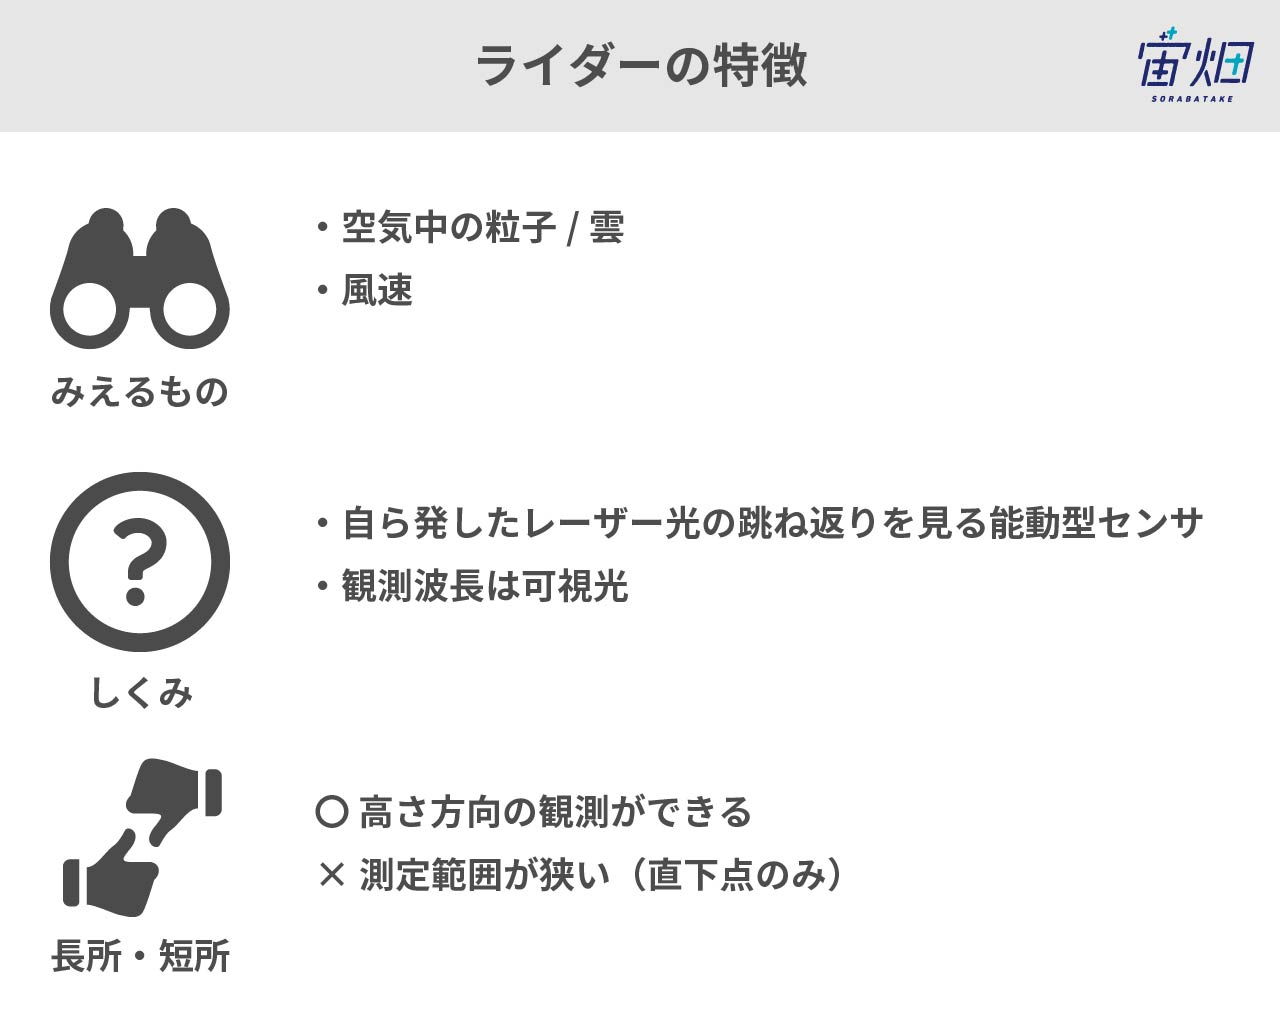
2.4.1.1 Lidar
Lidar is a sensor that emits mainly ultraviolet rays rather than microwaves and observes reflected rays*3. By observing scattered light, it measures the concentration of particles in the atmosphere. It is possible to grasp the motions of particles in the atmosphere or wind speed by utilizing the Doppler effect.
With lidar, it is also possible to obtain the information on the vertical direction, so it is useful for understanding the atmospheric structure, etc. However, its irradiation and observation ranges are narrow because laser is used.
*3: There exists another type of lidar that observes the infrared range instead of the ultraviolet range.
Outline of the ISS-mounted vegetation lidar mission MOLI and the situation of the trial production and tests of the laser emitter
https://laser-sensing.jp/34thLSS/34th_papers/0187_G-1_murooka.pdf
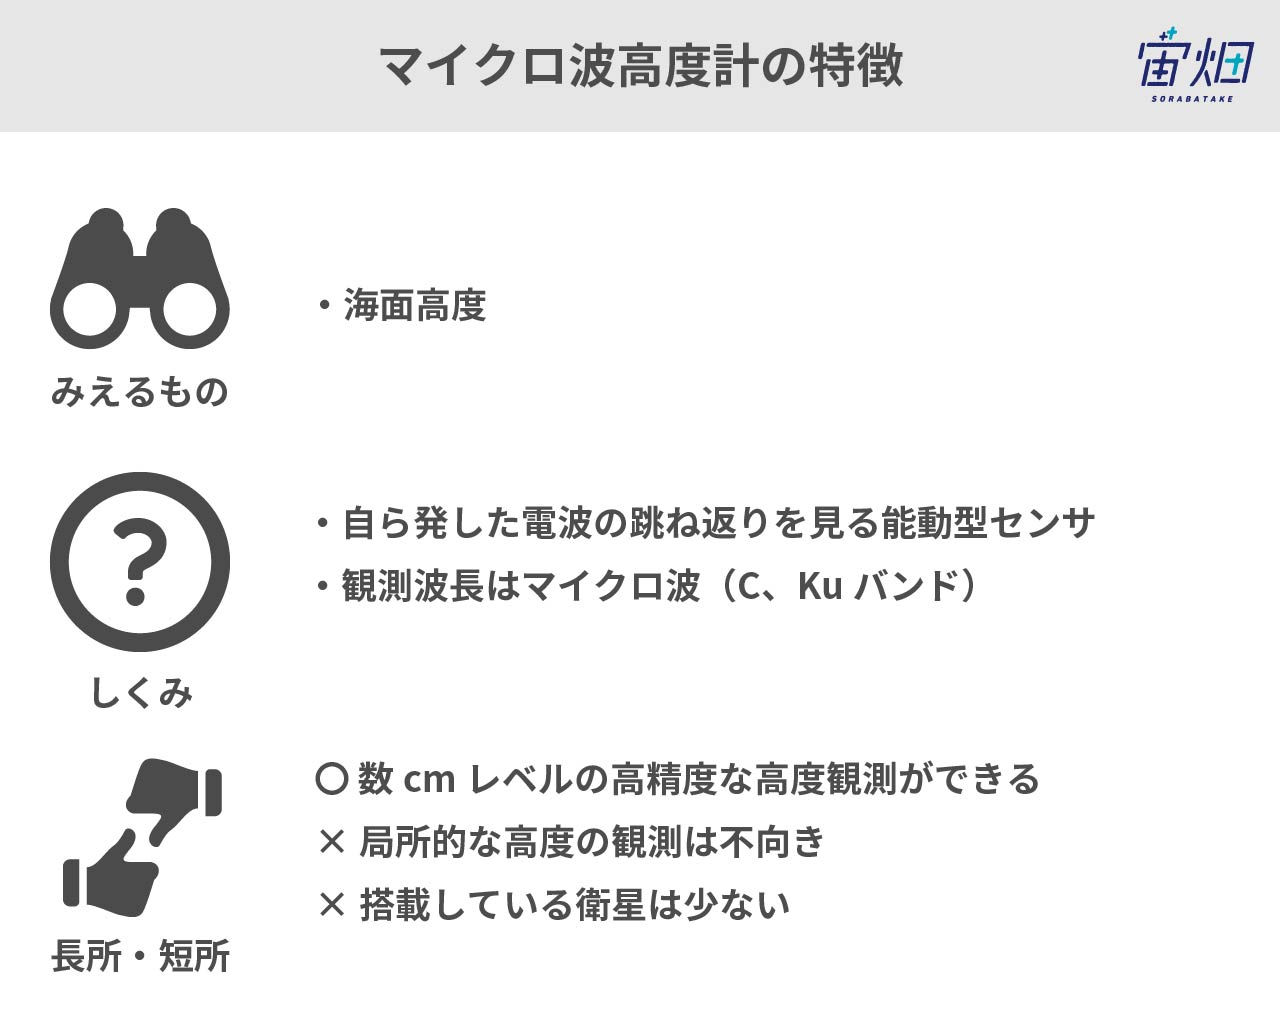
2.4.1.2 Microwave altimeter
Altitude is calculated from the time from the emission of microwaves from the sensor to the arrival of the reflected microwaves.
The degree of precision in the height direction is as high as a few centimeters, but the average altitude in the entire range (diameter: a few kilometers) irradiated with microwaves is used, so it is adopted as an altimeter for the sea surface rather than land areas. However, it does not observe swells, but macro-altitude, including tidal currents.
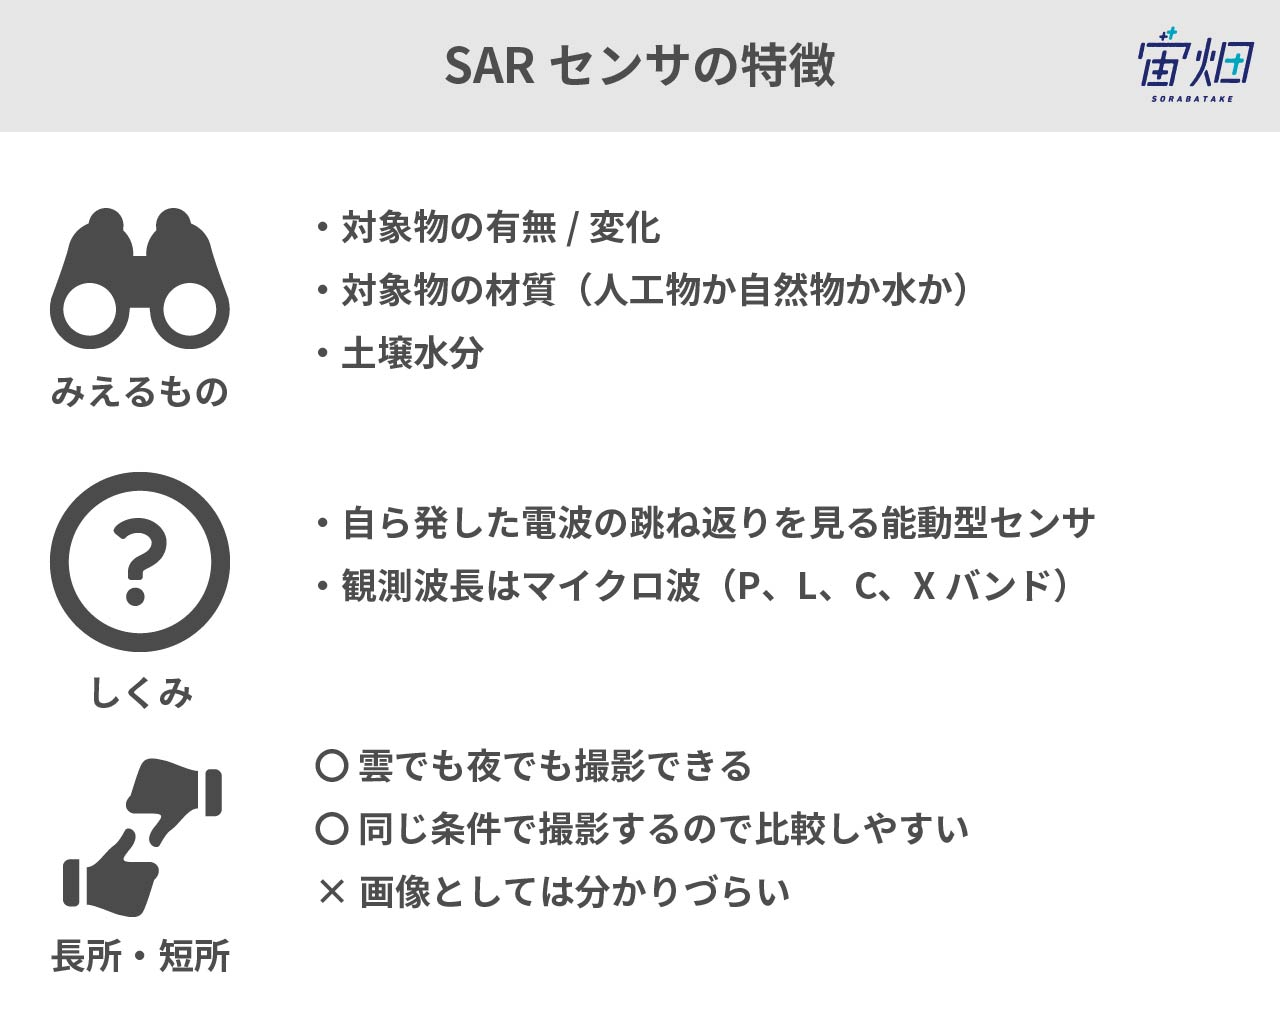
2.4.1.3. Synthetic aperture radar
Synthetic aperture radar (SAR) is a sensor that emits microwaves and detects the microwaves scattered from the ground surface.
Radio waves are scattered on rugged surfaces, which look white, and reflected on smooth surfaces, such as water surfaces, which look black with the sensor.
For details, see here: Basics of synthetic aperture radar (SAR)-Cases, what we can understand, sensors, satellites, and wavelength https://sorabatake.jp/3364/
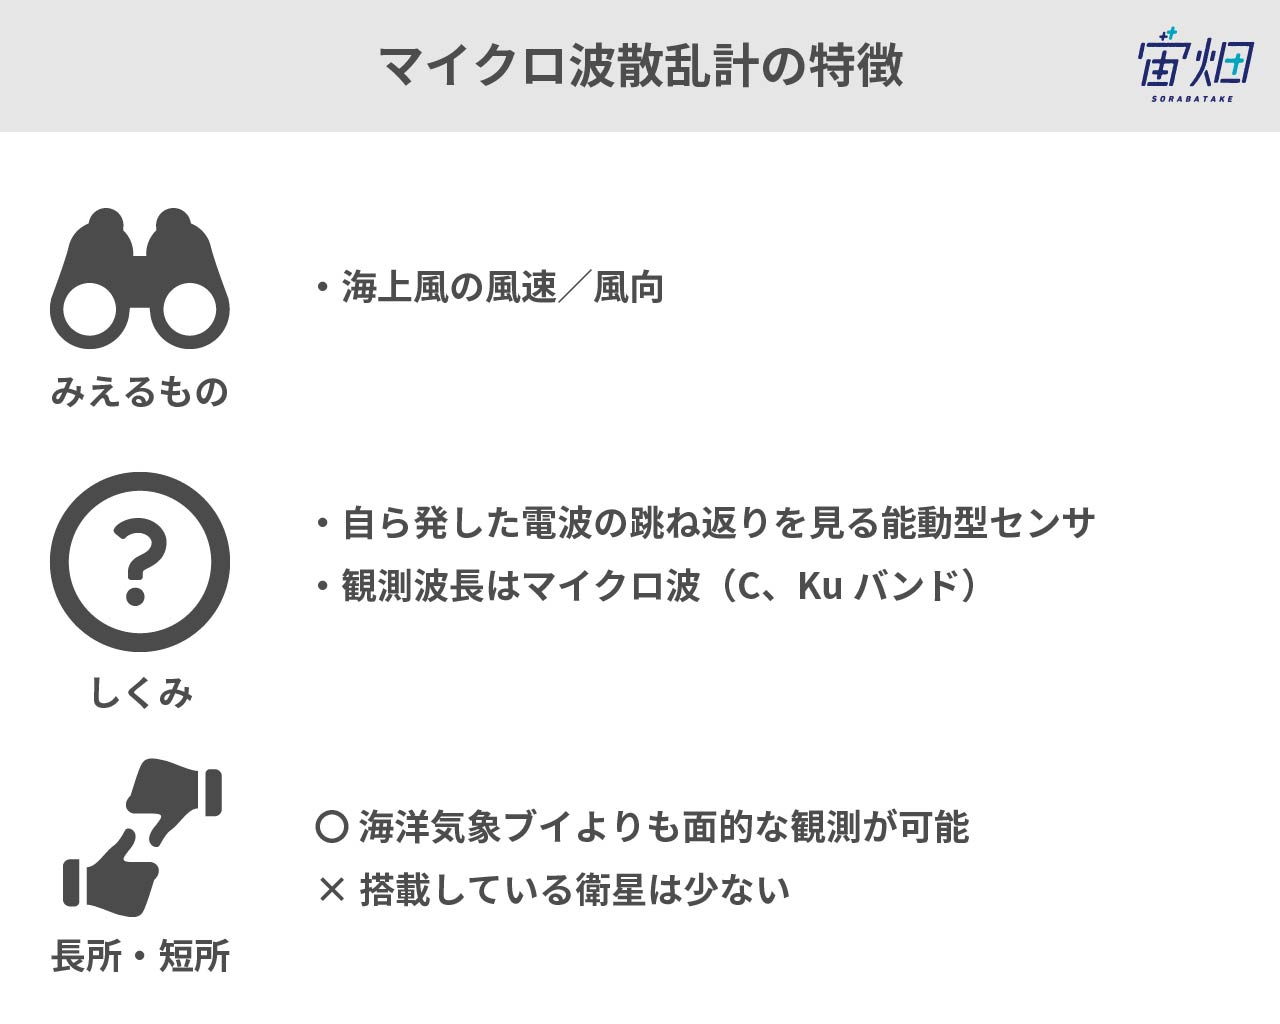
2.4.1.4. Microwave scatterometer
When the sea surface is irradiated with radio waves, the components of sea surface waves whose wavelengths are close to those of radio waves are scattered and detected by radar. The intensity of the signal varies according to the wind blowing above the sea, and is related to the direction and strength of the wind.
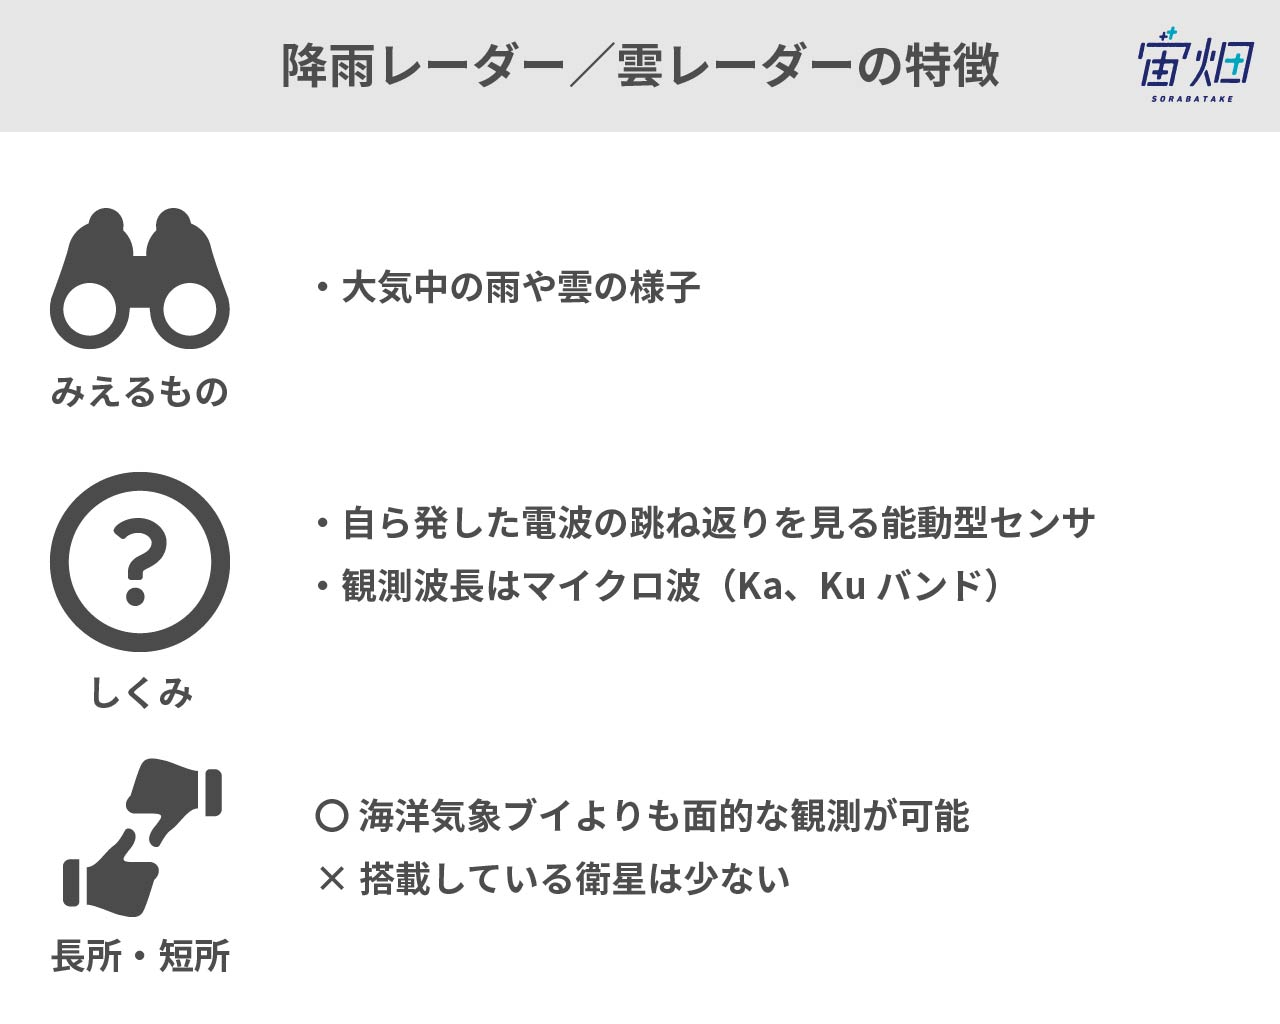
2.4.1.5. Radar
By using the microwaves (Ka band, Ku band, millimeter waves, etc.) that are scattered by the precipitation particles of the rain, cloud, etc. in the atmosphere, it is possible to measure the rain and cloud in the atmosphere.
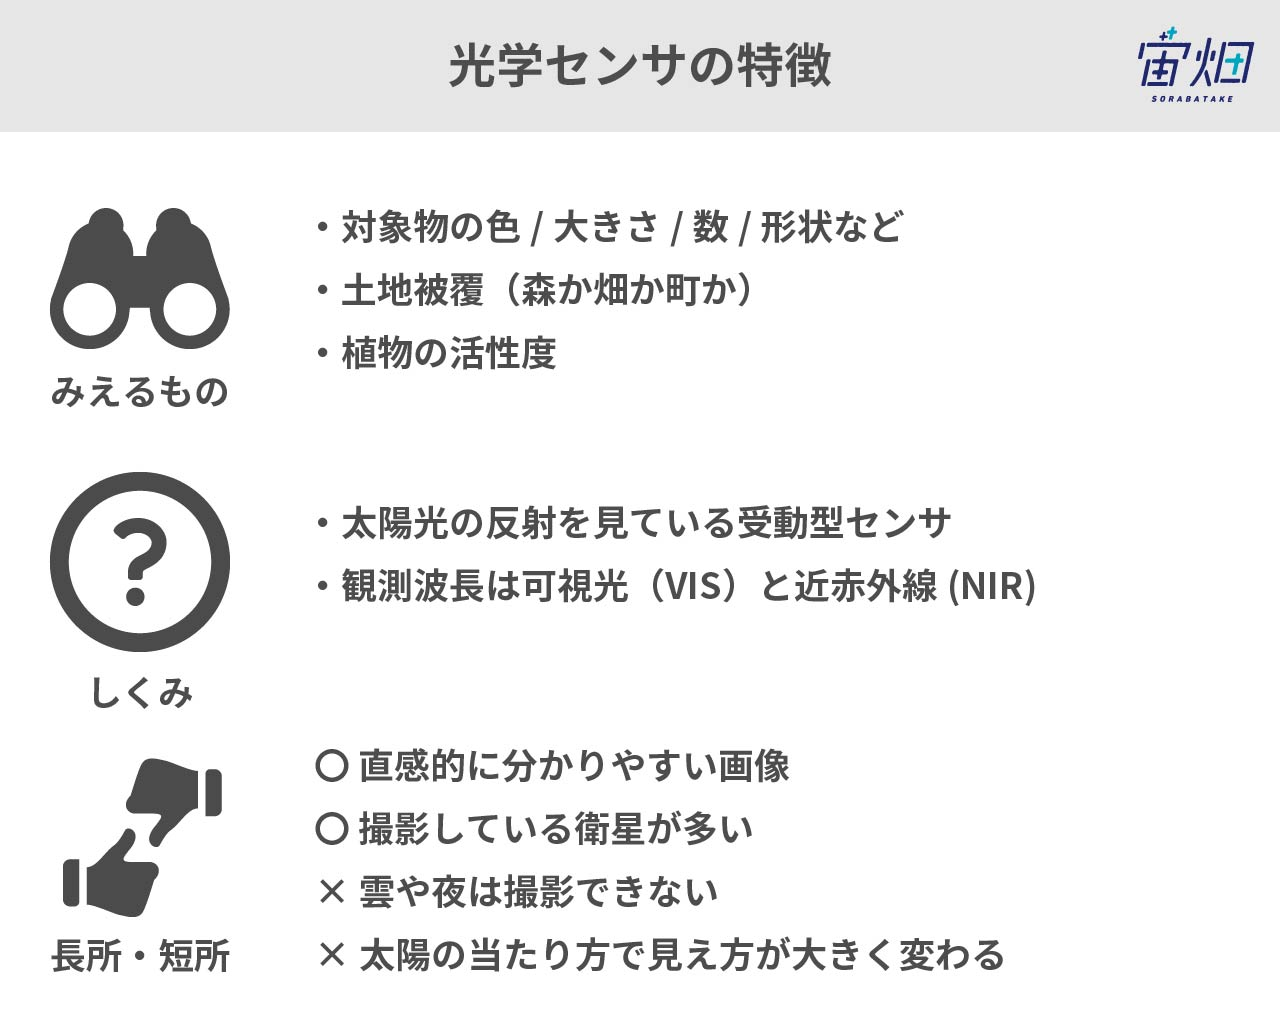
2.4.2.1. Optical sensors
This is the most common sensor mounted on satellites. This is similar to ordinary cameras we use on the ground.
In detail, this detects the light in the wavelength range that can be seen by the human eye called “visible light” and the “near-infrared” light. It is common that visible and near-infrared lights are observed by the same satellite.
With an optical sensor, we can see the “colors” of the object reflecting sunlight. Since this sensor detects reflected light, it cannot take pictures in the pitch-black night or the overcast weather.
For details, see here: Flexible according to issues? Objects and things that can be seen by using satellite data #Satellite data that can be understood with manga https://sorabatake.jp/5192/
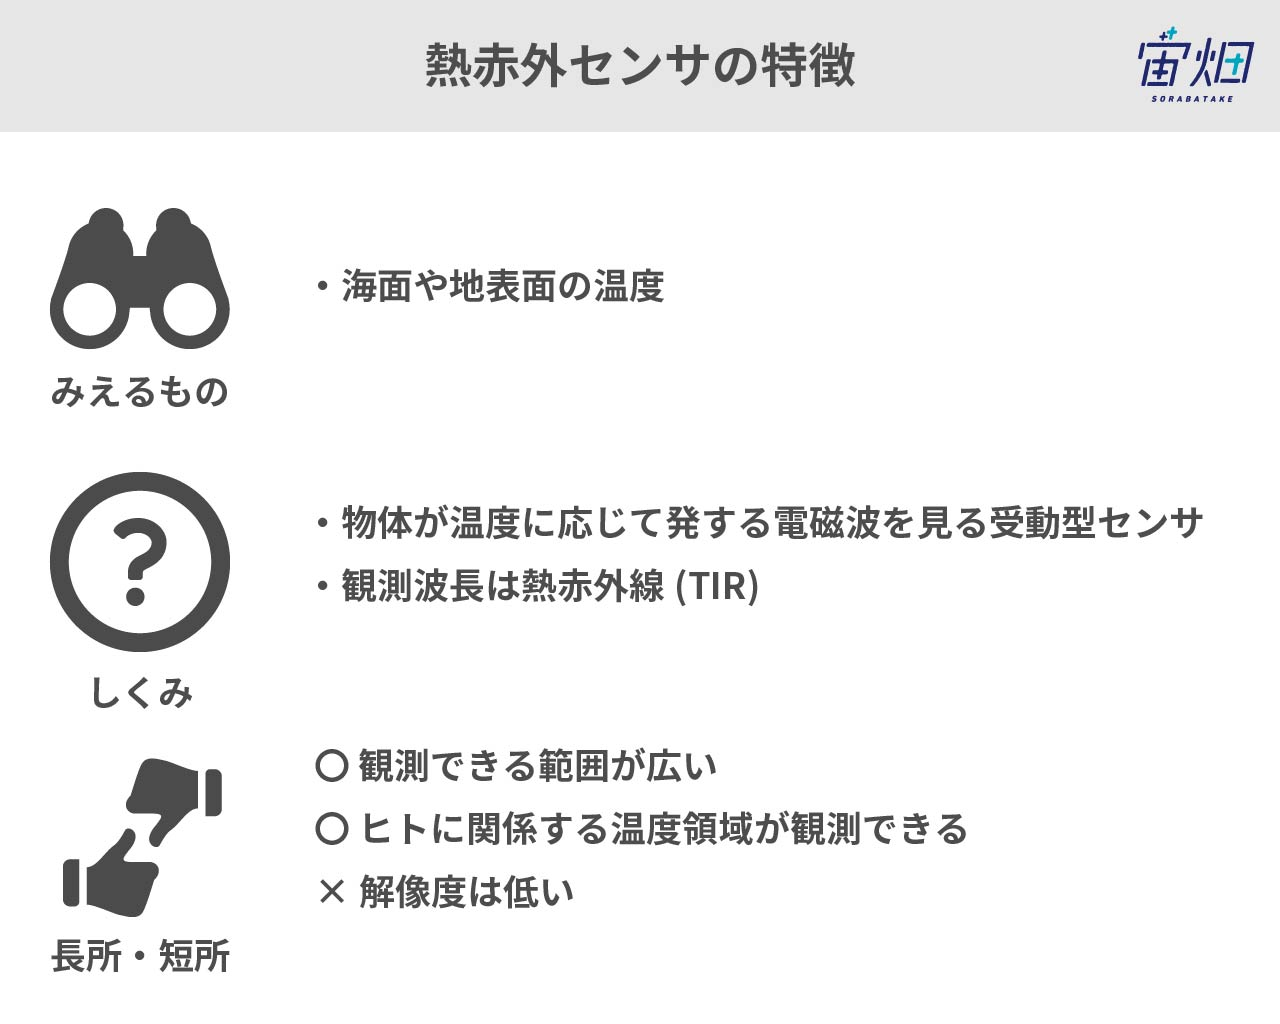
2.4.2.2. Thermal infrared sensors
By seeing the thermal infrared range, which has longer wavelengths than visual light, it observes the temperature of the ground surface.
The thermal infrared is the electromagnetic waves emitted by objects themselves, so it is possible to take pictures of geothermal heat and forest fires even at night.
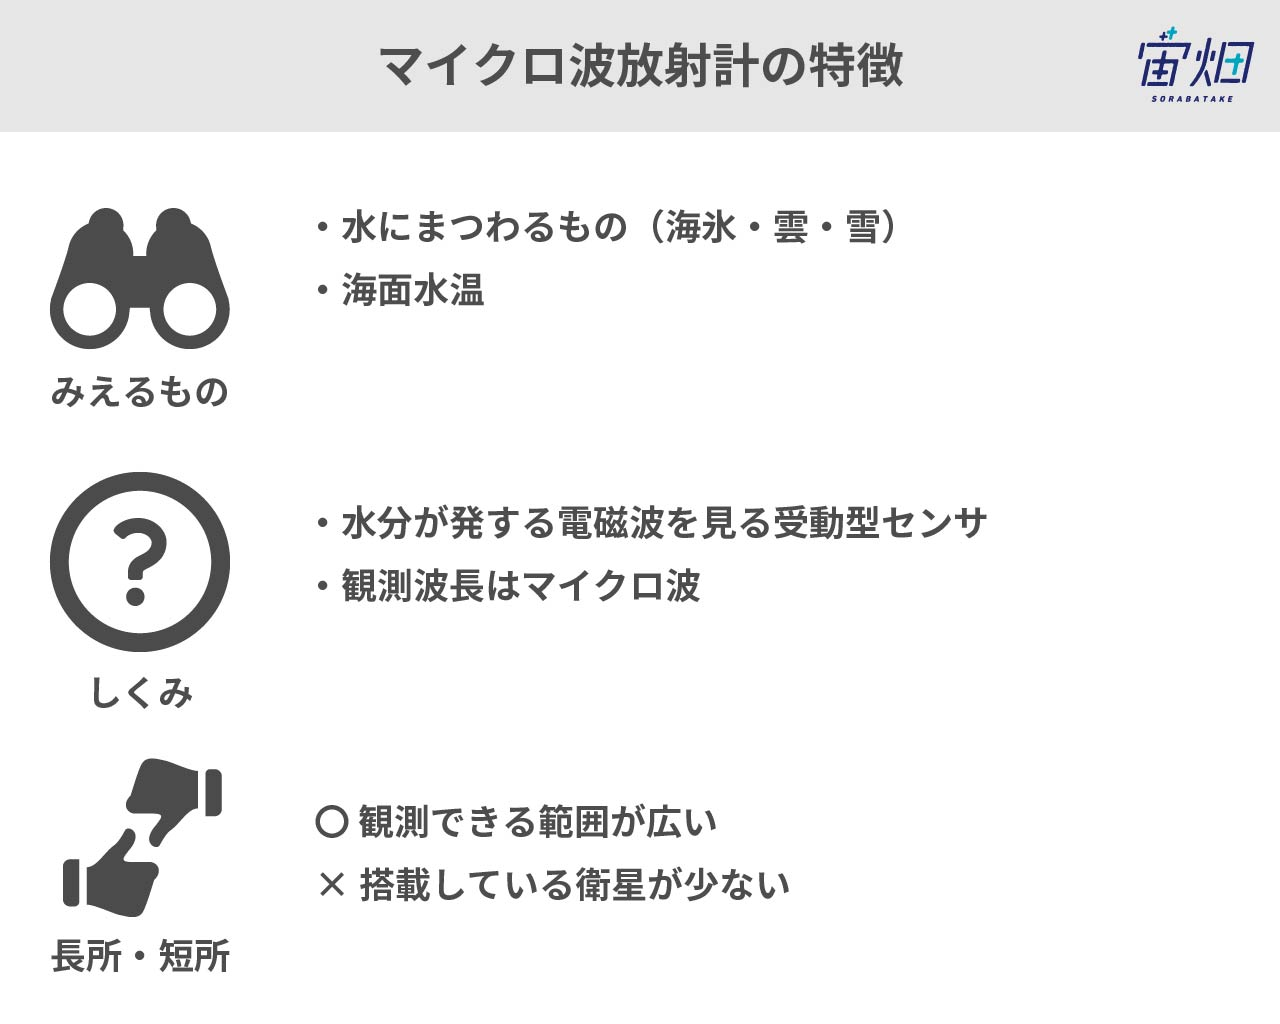
2.4.2.3. Microwave radiometers
Microwave radiometers observe microwaves passively. It is possible to observe the air temperature distribution, the absorption characteristics of atmospheric gases, the absorption and dispersion characteristics of water and ice particles, etc.
Due to the characteristics of microwaves, the observation range is broad, but resolution is low. Accordingly, the number of satellites mounted with microwave radiometers is small, but they are broadly used for weather forecast, etc.
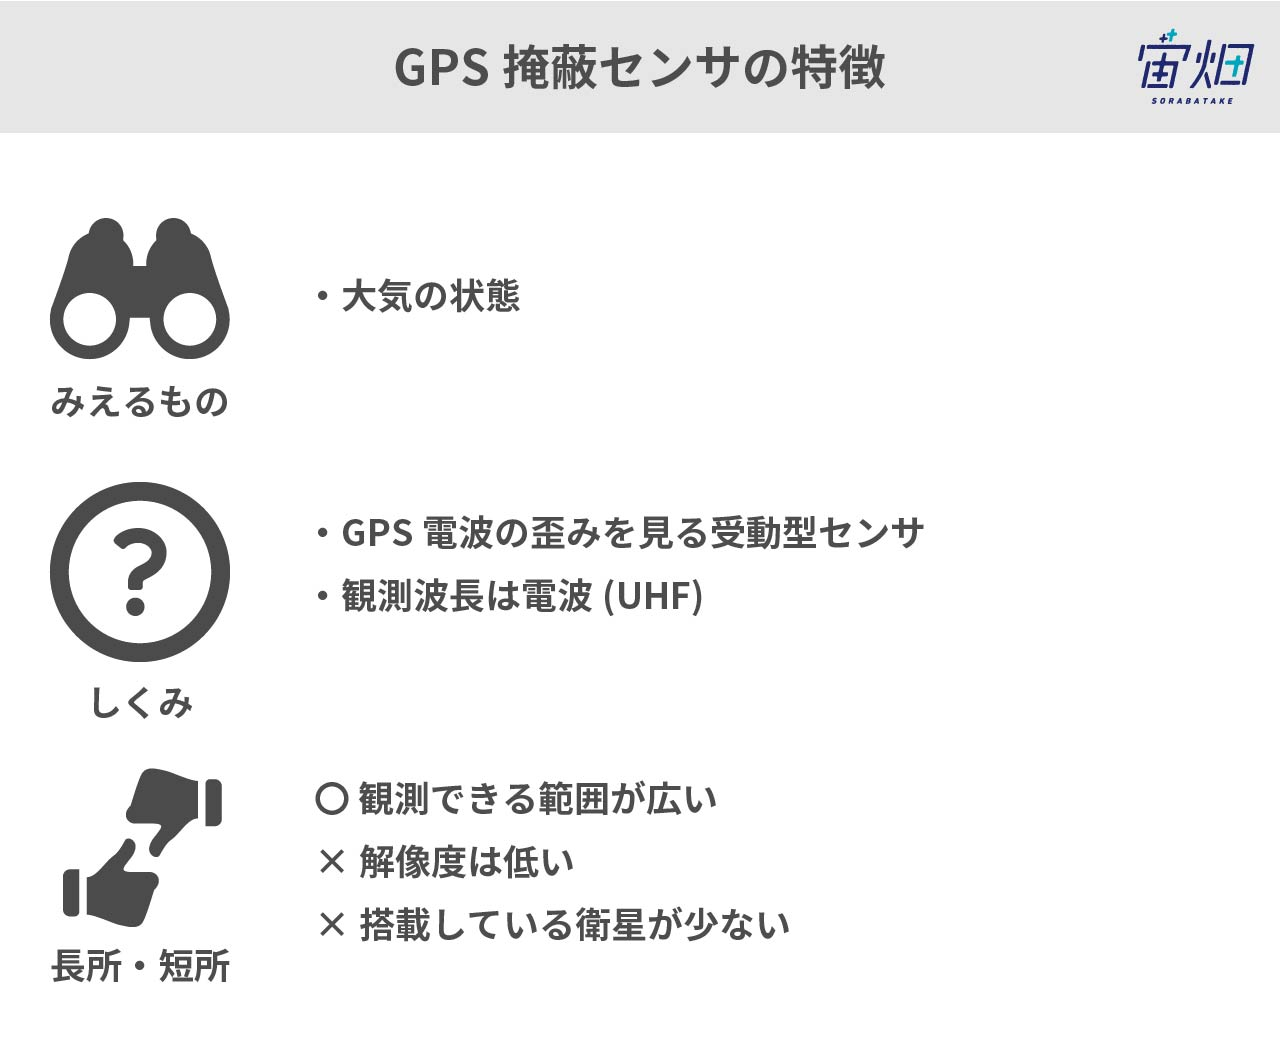
2.4.2.4. GPS radio occultation
GPS radio occultation (RO) observes those like precipitation radar by measuring the scattering of radio waves of GPS. It does not emit radio waves, so a satellite can be downsized. Since it can observe the atmospheric state, the precision of weather forecast can be improved with observation data.
2.5 Process of the Data reached
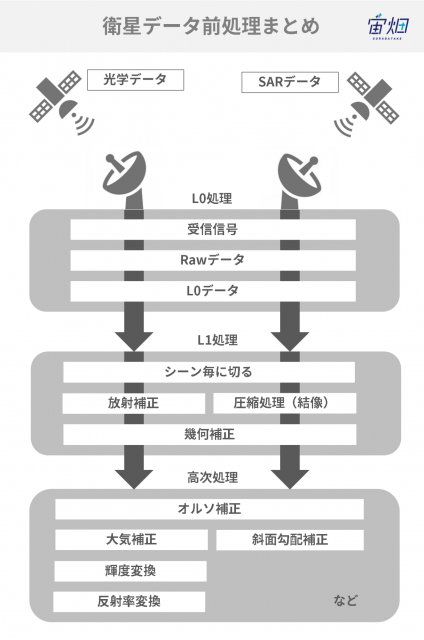
We can roughly divide the processing flow into three phases as in the figure: L0 processing → L1 processing → higher order processing.
The “L” of L0 stands for “level” and means the processing step. The processing proceeds to a higher order by increasing in level from L1 to L2 and then L3.
The term “standard processing” we hear when handling satellite data is processing officially issued by a satellite data provider. This may be just L1 processing for each data or it may also include higher-order processing.
2.5.1.L0 Processing
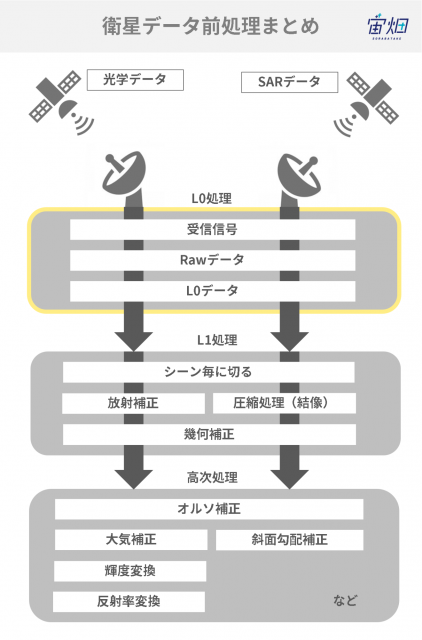
L0 processing is the first processing performed when data is received from a satellite.
If we look closely at L0 processing, we can see three steps:
(1) Radio waves from satellites are received by antennas on the ground
(2) The received signals are processed for transmission, so are returned to their original signals (raw data)
(3) Unnecessary information is deleted from the raw data (L0 data)
The expression “raw data” is commonly used around the world. However, it is important to note that the “raw data” in satellite data refers to data in this state of (2) and is data that we mostly do not touch.
L0 processing is performed based on the unique design of each satellite. Therefore, it is almost always performed by the company or organization which owns that satellite.
2.5.2. L1 Processing
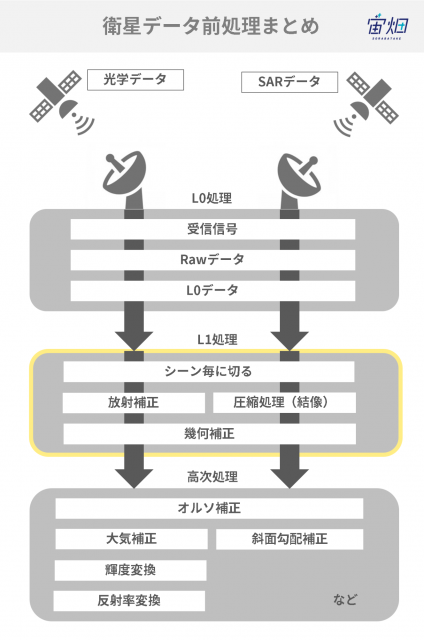
L1 processing is the basic processing from level 0 to level 1 which is almost all common no matter what sensor is equipped to the satellite.
We can broadly divide L1 processing into three stages:
(1) Extraction for each scene
(2) Image sensitivity adjustment / imaging and creation of a picture
(3) Removal of image distortion
These processes are also unique to each satellite. Therefore, they are almost always performed by the company or organization which owns that satellite.
Let’s take a closer look at each process.
Extraction for Each Scene
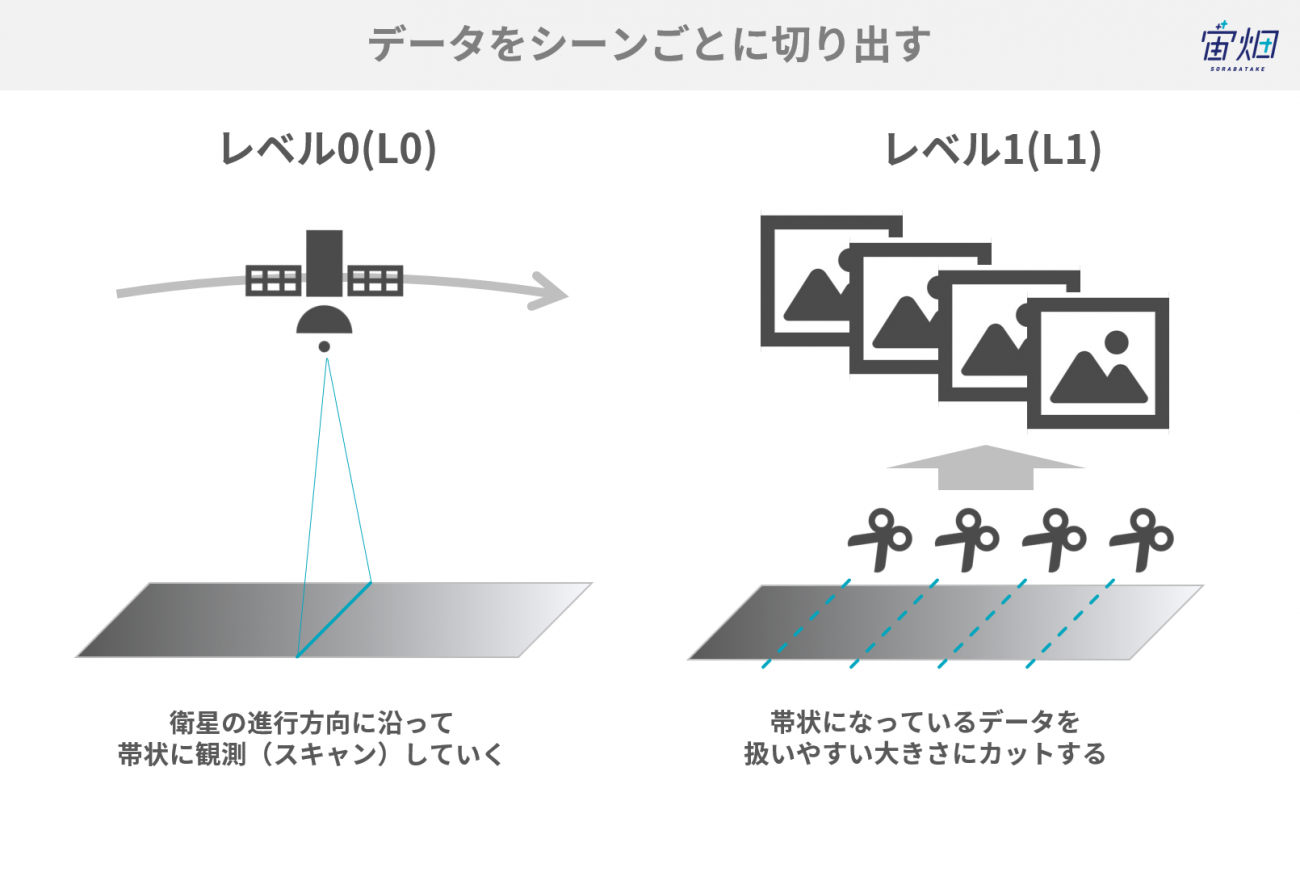
The first process is one in which belt-shaped data observed (scanned) in the order satellites fly are cut photograph by photograph – “scene” by “scene.”
This cuts it down into a quantity of data that be easily processed in the subsequent stages.
This level is called L1A in the sensor of AVNIR-2 that is equipped to ALOS for example. The information required for the subsequent processes (parameters) is also provided together. Therefore, with knowledge, the subsequent processing is also possible.
This is data before the various corrections we will explain later are made. Accordingly, these may be images that are not suitable for beginners.
Radiometric Correction (Sensitivity Adjustment)
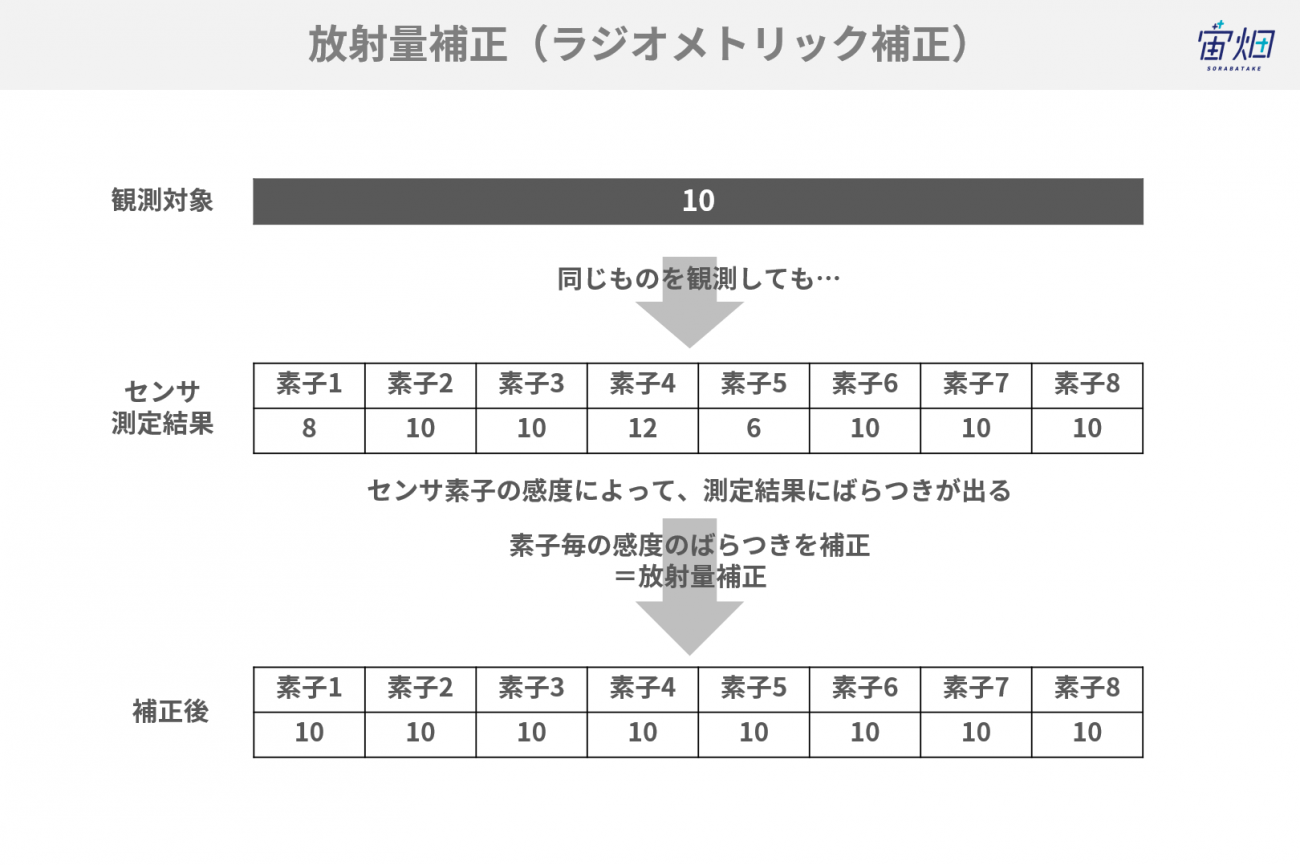
Have you ever seen lines on an image due to the output of a poorly performing copier?
When observing with the sensors of a satellite, if there are variations in the properties of each element and beam, the images will not be clear. The correction to produce clear images without unevenness is radiometric correction.
The sensors are checked and the correction method is determined prior to launching a satellite. However, the sensitivity may alter depending on the vibrations and thermal environment at the time of the launch. In that case, we adjust the data actually observed so that it can be corrected properly.
This processing level is called L1B1 in the case of the AVNIR-2 sensor of JAXA.
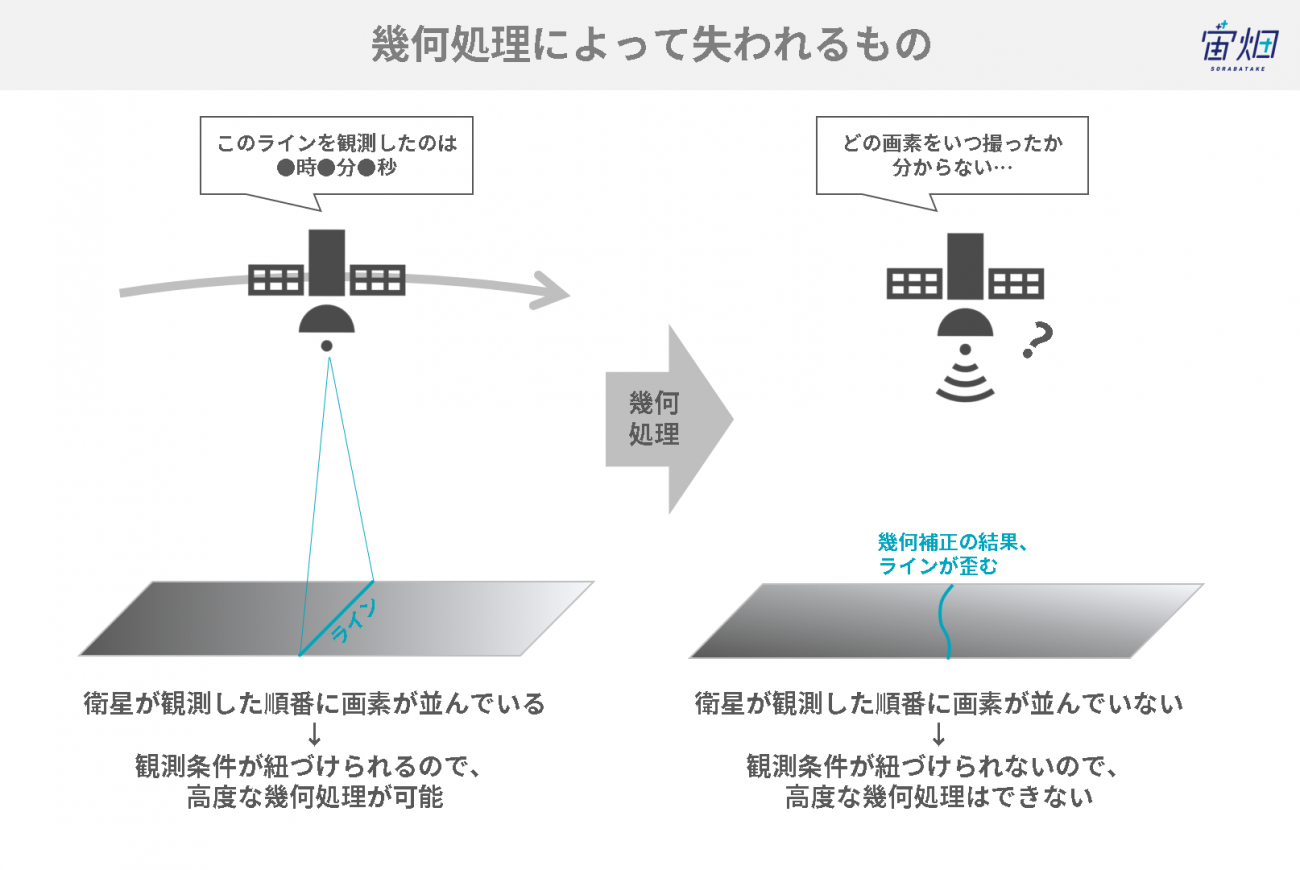
Geometric correction is performed in the subsequent processes. Therefore, the L1B1 data is in the final state in which the pixels are arranged in the order captured by the satellite.
If you wish to perform advanced geometric processing yourself, you will need information in terms of when the data was captured. Therefore, we use 1B1.
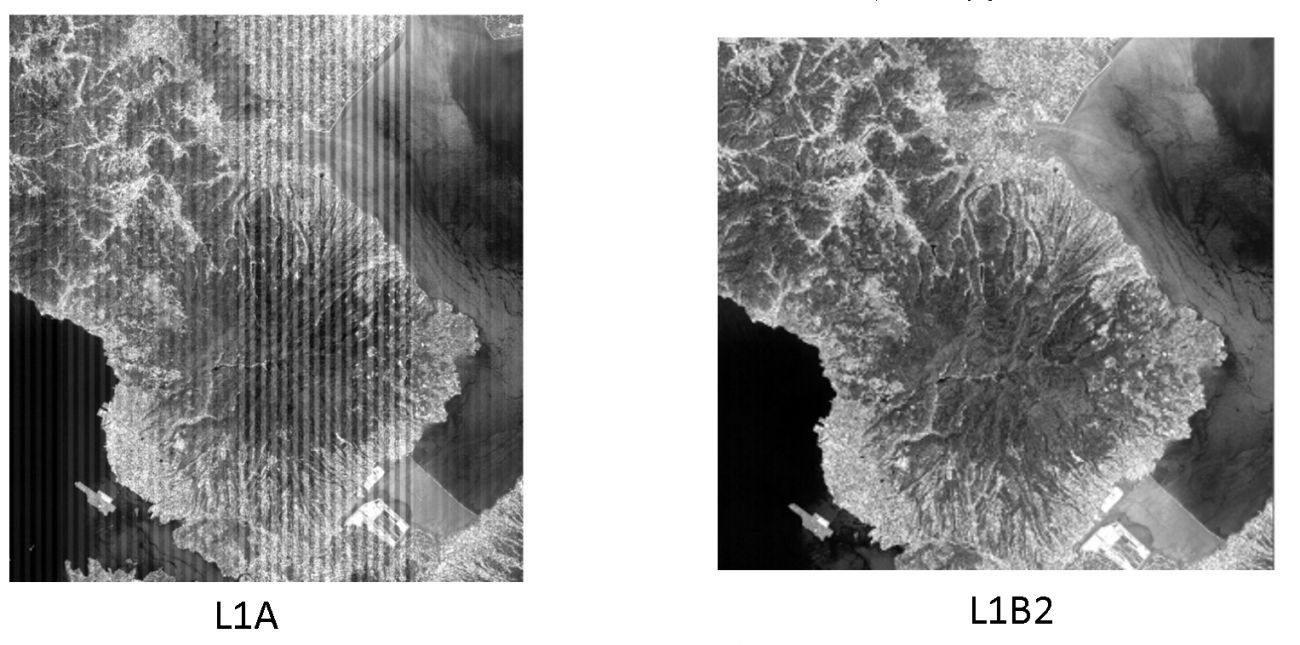
Removal of Image Distortion (Geometric Correction)
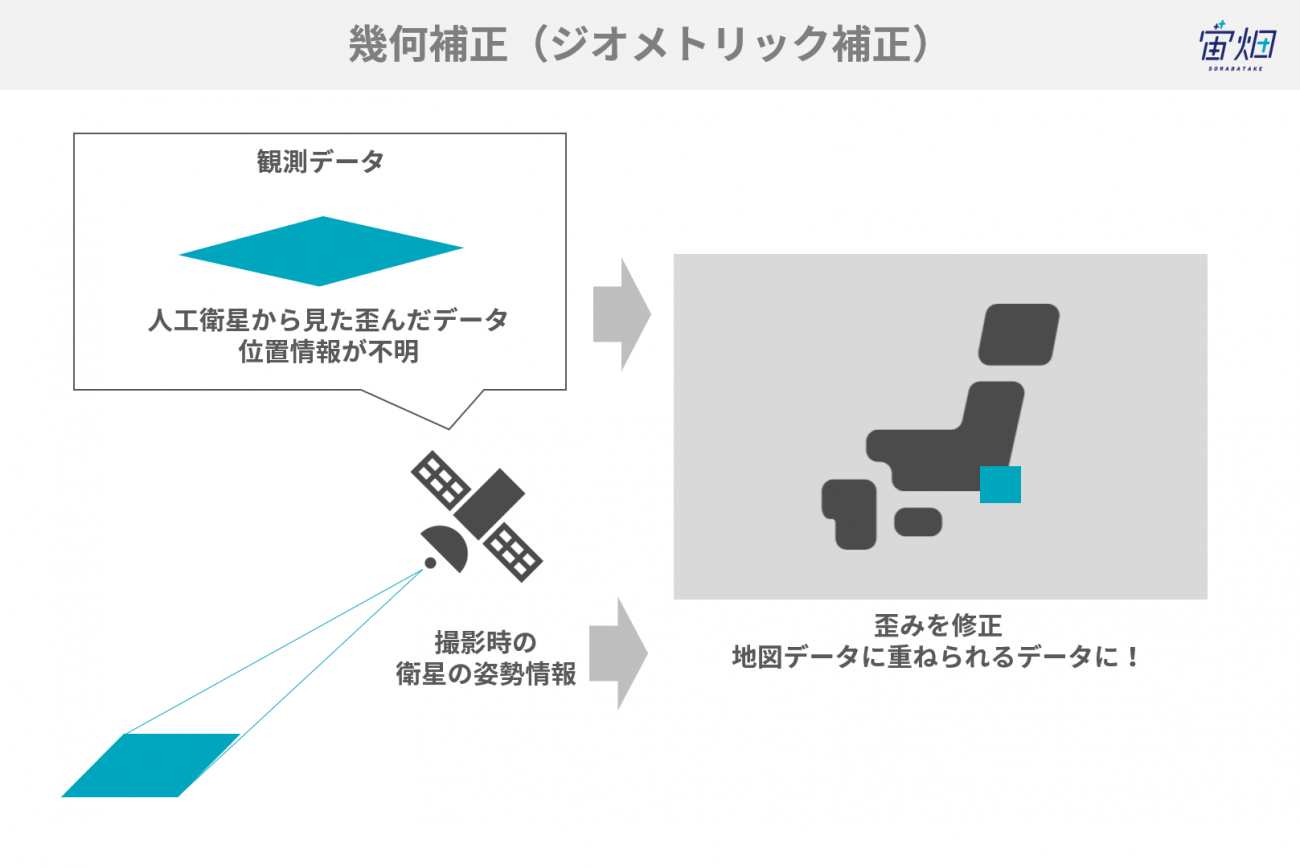
Artificial satellites capture data at once in a wide area while facing various directions. Accordingly, there are distortions and deviations in the captured data. This means it is not possible to overlay this data on a map as it is.
Geometric correction is a process in which observed images are transformed so that they have no distortions and overlap properly onto maps.
The positional information is calculated on the images and the geometric distortions are corrected from the information in terms of what direction the satellite observed the data from in what position.
At the same time, sensor-specific distortions (mainly due to the scanning method) are also corrected.
Let’s take a look at this with the example of ALOS images. L1A (left) is distorted with streaks remaining on the image. However, with the geometrically corrected L1B2 (right), we can see that the streaks have been removed and the distortion has been corrected. We finally at this point have clear images without distortions.
Credit : JAXA
2.5.3. Higher-order Processing
Let’s take a look at ortho correction, atmospheric correction, brightness conversion and reflectance conversion.
Ortho Correction
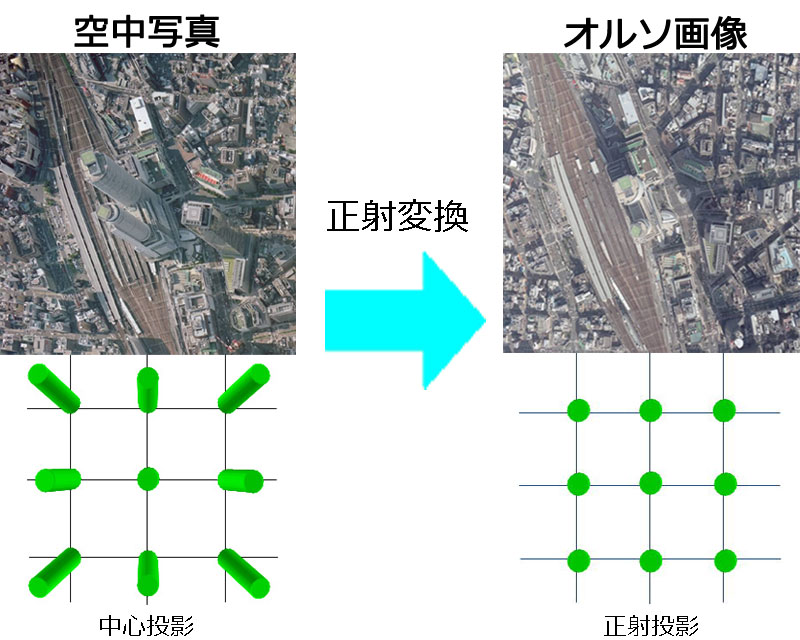
Ortho Correction Example (Image: Aerial Photograph)
Credit : Geospatial Information Authority of Japan
Ortho correction is a process in which target objects with a high elevation (e.g., tall buildings and mountains) that appear slanted are restored to look as though from directly above. This results in data that fits perfectly onto maps.
This ortho processing is becoming standard for commercial satellites. This means that use in this state is common.
Ortho processing may seem all-powerful. However, it does have one pitfall. It is not possible to see things that cannot be seen. For example, we frequently see sides facing the satellite with the slopes of mountains. The opposite slope is not visible.
The part we cannot see is filled with neighboring pixels and then positioned correctly geometrically in ortho correction. Therefore, the information of the part we cannot see is uncertain. The person in charge of interpreting the image on site utilizes this correction while fully keeping in mind this fact.
Atmospheric Correction
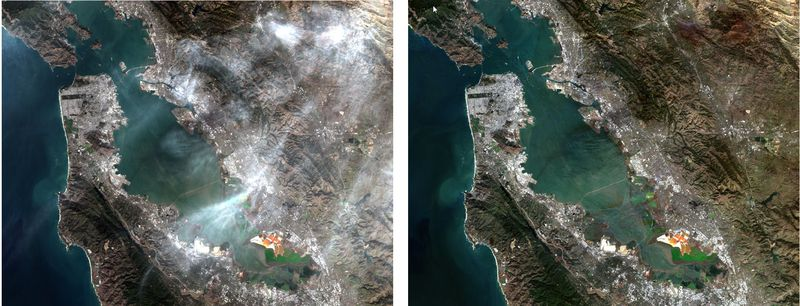
These are images before (left) and after (right” the correction of Sentinel-2 data in San Francisco.
Credit: Hexagon Geospatial c/o Nippon Intergraph Co., Ltd.
In the case of “optical data” the appearance of the ground surface is observed interposed with the atmosphere. Consequently, the obtained data is affected by the atmosphere. Atmospheric correction is processing in which the effects due to scattering and absorption from the atmosphere are hypothesized and then this is offset. It is possible to obtain brightness on the ground surface not reliant on the state of the atmosphere with atmospheric correction.
Brightness Conversion
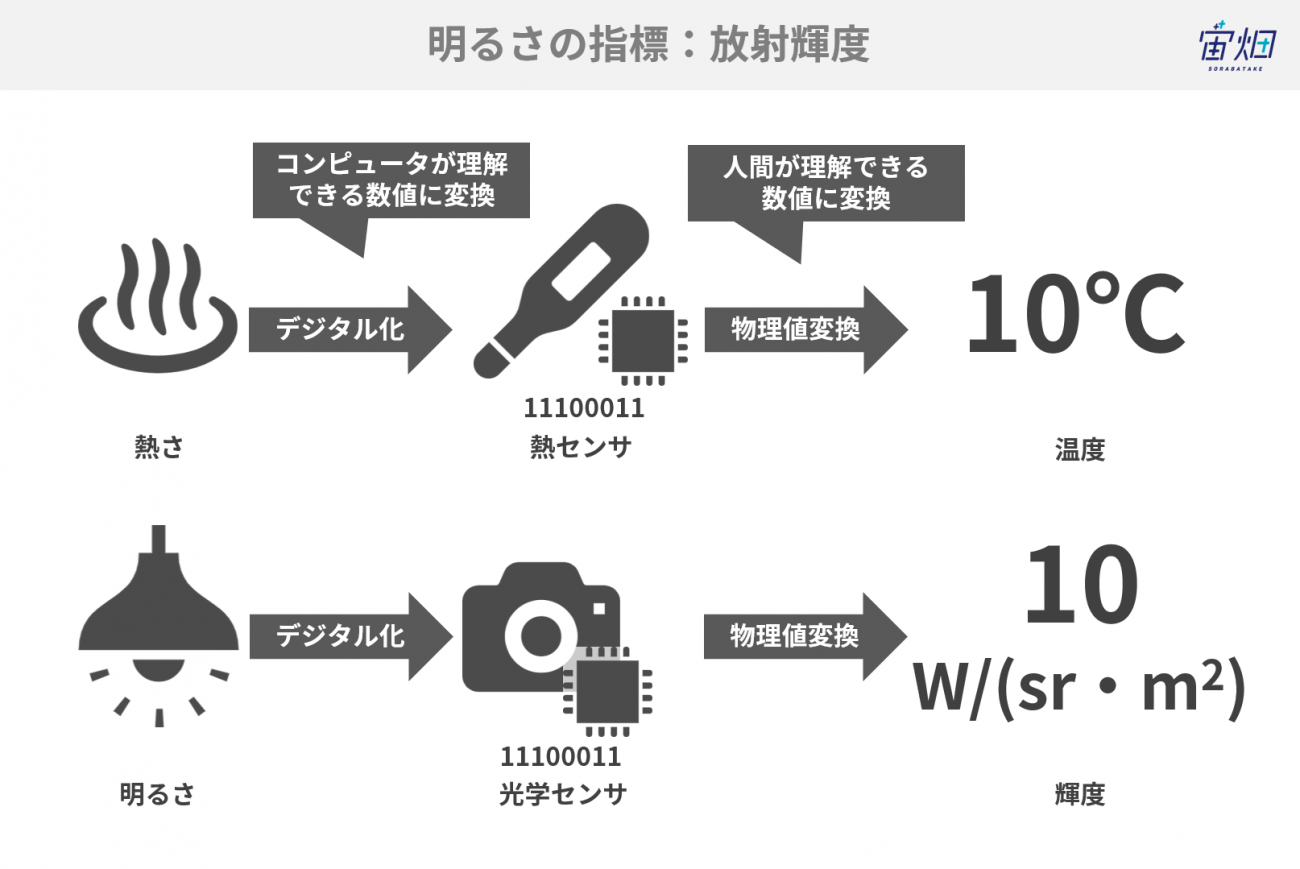
The brightness index indicated by optical data is called “radiance” like the warmth index is called temperature. The value originally possessed by the data is an integer value that is not the radiance (a numerical value from 0 to 255 with 8-bit). This value is applied to the formula given for each sensor. With this, it is possible to calculate the radiance.
*This process itself is one in which the numerical values possessed by L1 products are corrected to a physical quantity instead of a higher-order process.
Reflectance Conversion
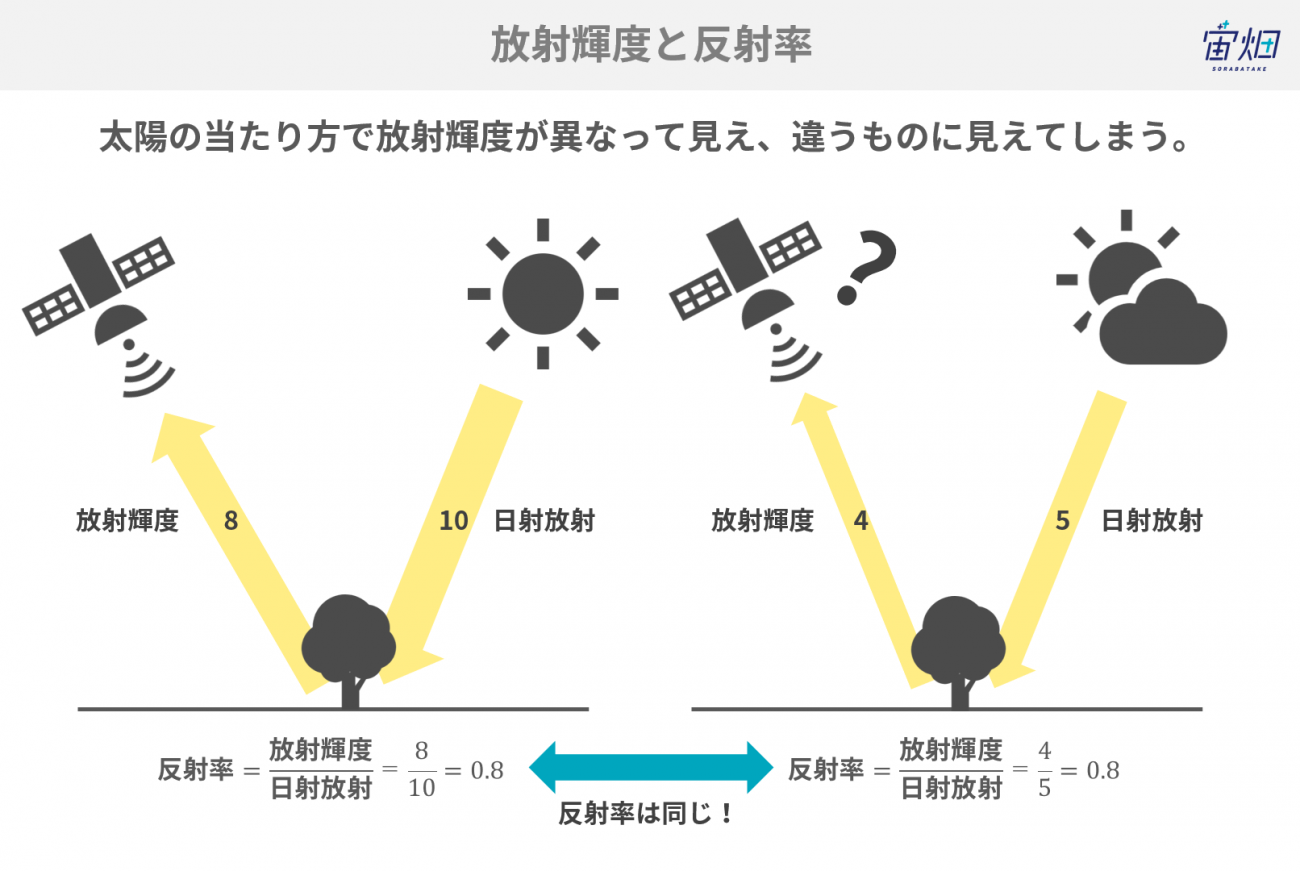
The radiance of the ground surface changes depending on the differences in the intensity of the sunlight and how it hits the surface. For example, the sun shines differently near the equator than it does at the North Pole. It also varies depending on the season. There are also cases when reflectance may be required in terms of the radiance / solar radiation observed by the satellite to reduce that difference. This also includes surface reflectance as the result of atmospheric correction and radiance reflectance observed by the satellite – in other words, top of the atmosphere (TOA) reflectance.
Please see the “Illustration: What Is the Pre-processing of Satellite Data: Overview, Processing Contents by Level and Explanations” for details.