1. Basics of remote sensing
1. Adoption of remote sensing
Remote sensing is a technology to remotely obtain information on the earth surface through an artificial satellite or aircraft. To be precise, it is a series of processes in which the censor of an artificial satellite catches the energy reflected or radiated from a subject, processes and analyses the obtained information according to a purpose for its utilization.
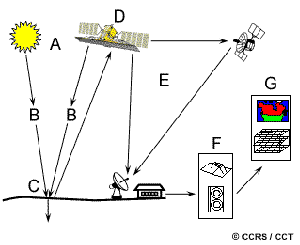
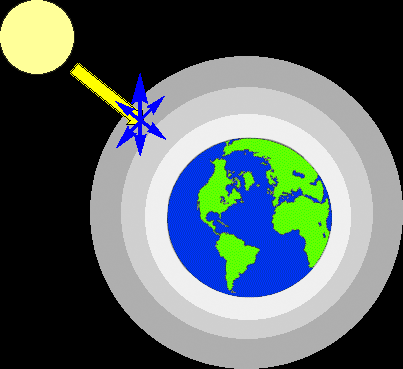
A: Illuminant or source of energy: Remote sensing cannot be carried out without a source of energy or an illuminant (such as the sun) providing electromagnetic radiation to the interested object.
B: Radiation and atmosphere: Energy radiated from the surface of the sun or an artificial satellite passes through atmosphere while interacting with it. This also takes place when energy reflected by the subject of observation is received by the censor of an artificial satellite.
C: Interaction with the target substance: Depending on the physical and chemical properties of an object, reflected or radiated energy is observed by the censor of an artificial satellite.
D: Measurement of energy by censor: After energy is reflected, scattered or radiated by a subject, the censor of an artificial satellite is used to collect and record that electromagnetic radiation.
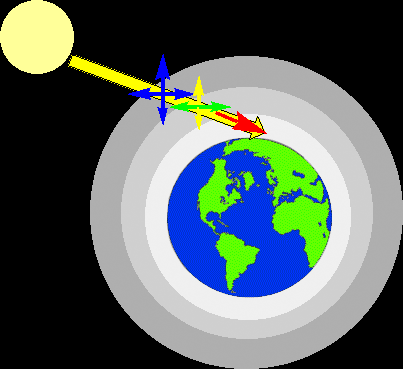
E&F: Transmission, receipt, and processing: After energy is detected by the censor, electronic signals are sent to a ground station. Signal data are processed and images are outputted. The processing includes multiple stages, which will be explained in detail in another tutorial.
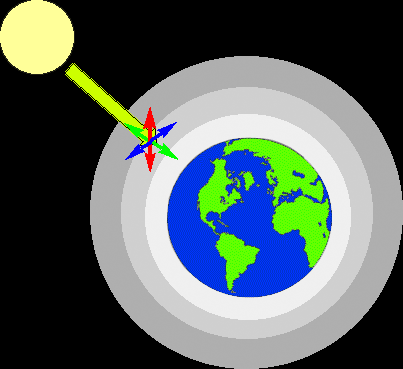
G: Interpretation, analysis, and utilization: The output image undergoes various processing, and information according to a purpose is extracted. Data obtained through satellite remote sensing allows you to provide uniform and a wide range of information that cannot be obtained from data acquired only on the ground. It can be used in various, wide-ranging fields.
1.1 Electromagnetic radiation (electromagnetic waves)
In remote sensing, source of energy which irradiates the object plays a crucial role. It is observed as electromagnetic radiation. This can be found in the sunlight, radiation from the earth, and also radiation from an artificial satellite. Electromagnetic waves refer to the flow of energy in which an electrical field (E) and a magnetic field (M) move at right angles. The energy is called electromagnetic energy.
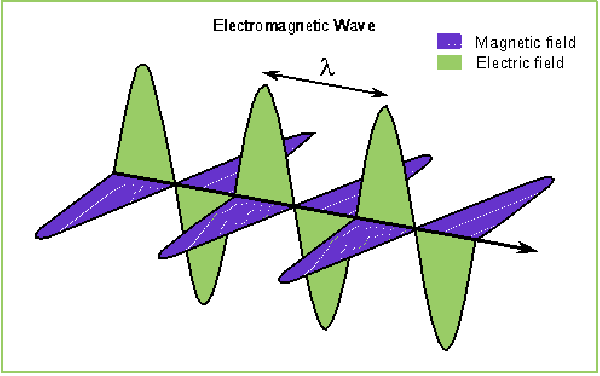
Wavelength refers to the distance between two troughs of a wave (or the cycle of a wave). It is normally represented as λ, and millimeter (mm) or nanometer (nm) is used for its scale.
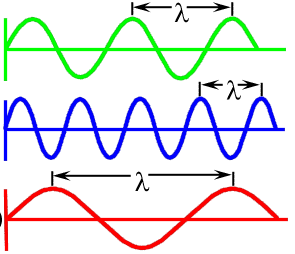
The above figure shows the relationship between frequency and wavelength. A long wavelength means high frequency, and a short wavelength means low frequency. Frequency is generally represented as hertz (Hz). Light moves at a same speed, but their waves differ from each other as shown above. Please refer to the following explanation for further details.
1.2 Electromagnetic spectrum
Satellite images commonly viewed by people look almost the same as the pictures taken by smartphones and digital cameras. However, satellite images carry information different from ordinary photographs. In a smartphone or a digital camera, an image built up by concentrating light from a subject is processed as an electronic data on an image sensor. The image that is outputted is the same as how our eyes captured it. On the other hand, a satellite image is expressed by combining various measured wavelengths (these include data of wavelengths that can be and cannot be captured with human eyes. The inclusion of the visible ray wavelength zone is an essential difference between a satellite image and a photograph.) Therefore, it can project information which cannot be seen with the naked eye as an image.
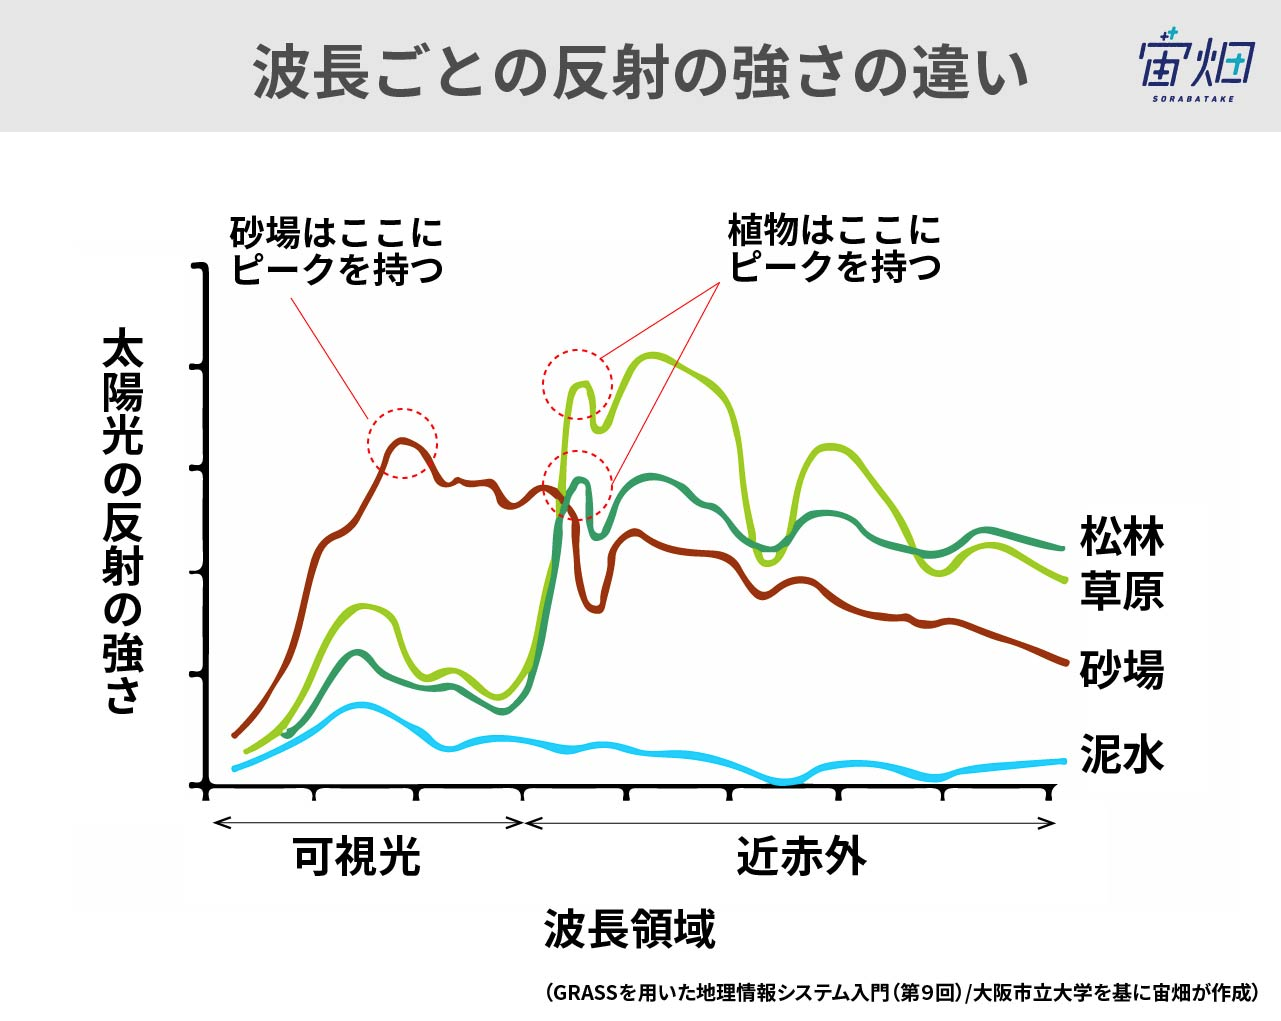
All the substances on the earth surface characteristically absorb, radiate, and reflect light depending on their reciprocal actions. For example, chlorophyll, which is consisted by plants, absorbs the red and blue lights, but reflects the green light and infrared rays. Due to this characteristic, plant leaves appear green to us. Such patterns of absorption and reflection peculiar to a substance is called a special signature.
What kind of combination of wavelengths can make what kind of colors stand out? As a simple example, it can be explained as the above figure. The vegetation index given in the above example is not a multispectral image (an image composing multiple wavelengths) in a strict sense, but it is an image created by utilizing the characteristics of plants in which they reflect near infrared rays but absorb wavelengths in red. True-color image and false-color image are the typical examples of images created through composition of wavelengths.
Original data provided by JAXA
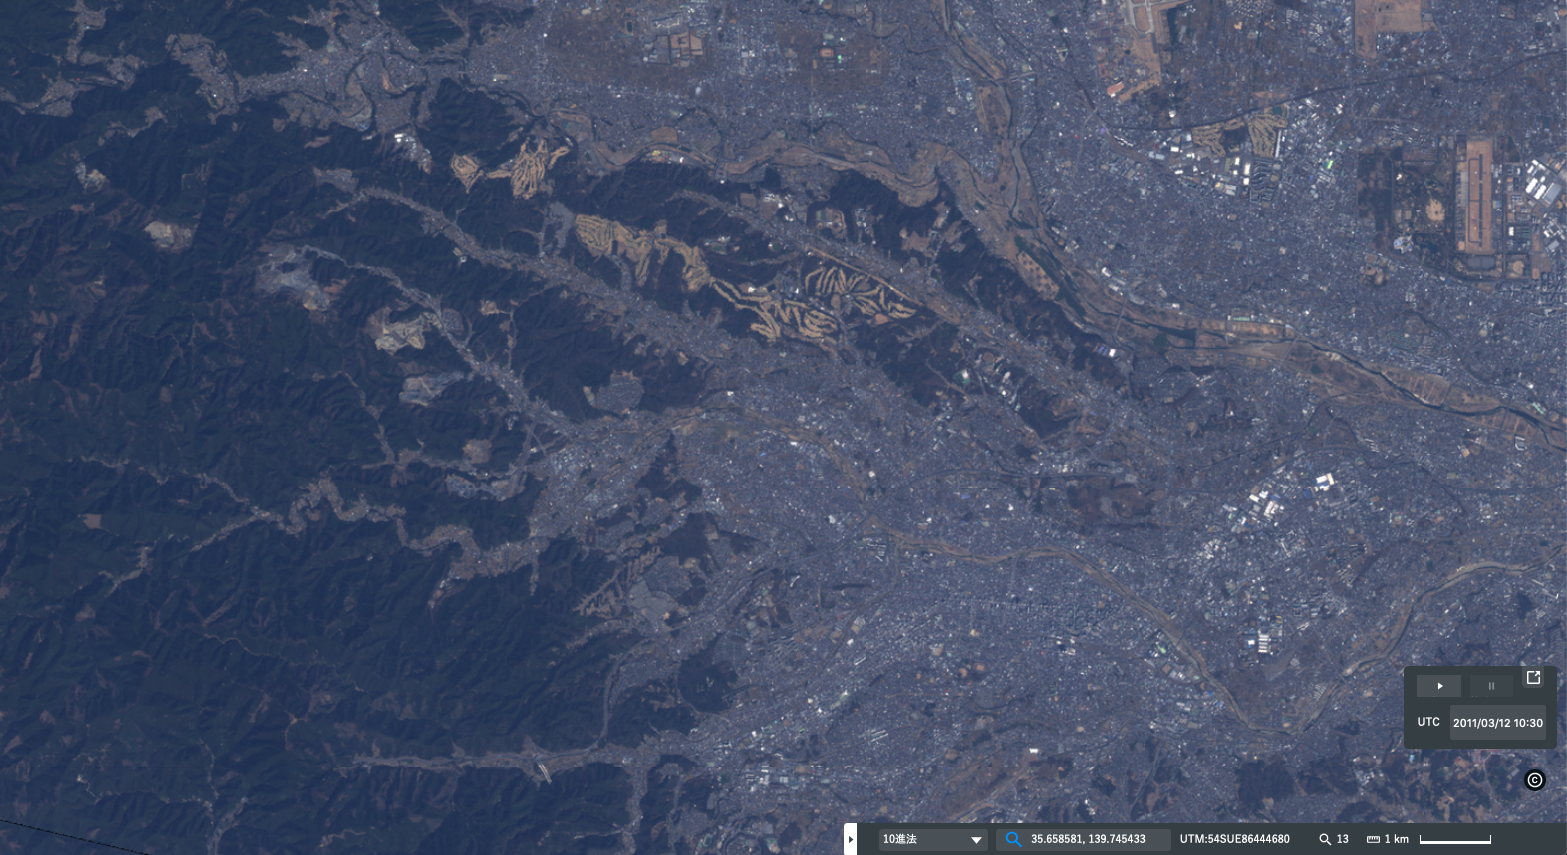
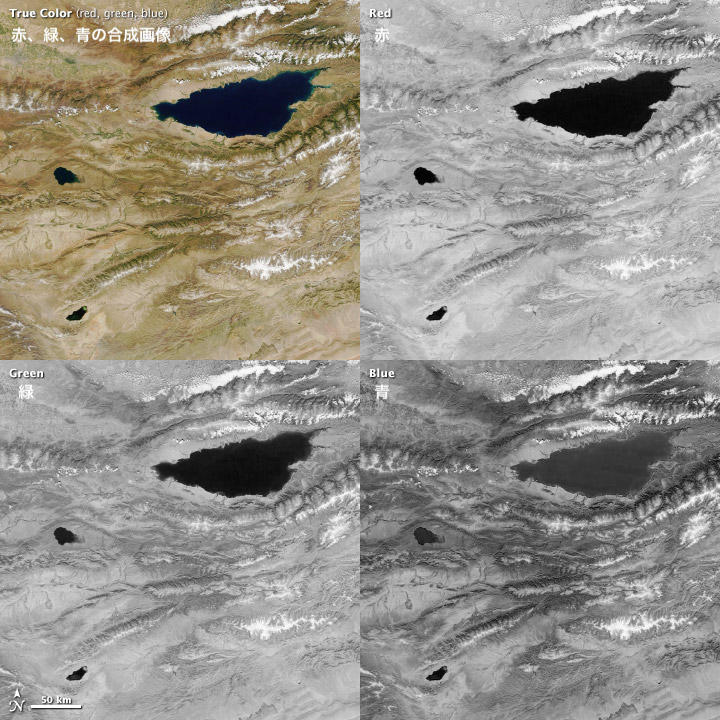
True color is the combination of red, green and blue (RGB) lights. Its image is similar to the world visible to human eyes.
Original data provided by JAXA
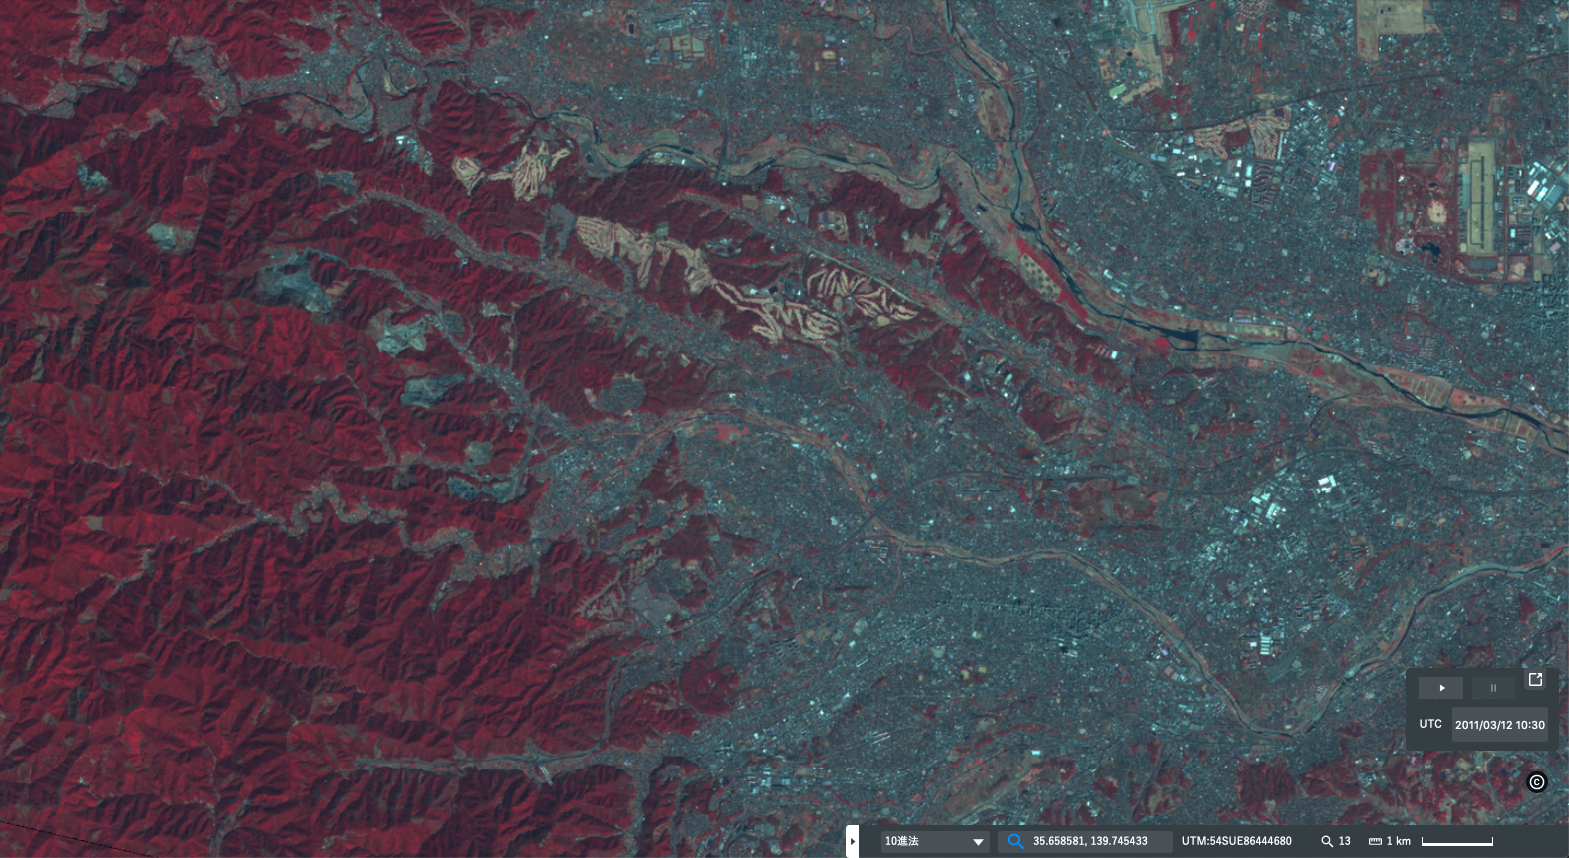
False color is an image in which short R is allocated with the short-wavelength infrared light, G with the red, and B with the green wavelength. As far-infrared rays allocated to Red is reflected differently in this image, it becomes possible to consider to what extent plants grow well and grow thick. For example, plants reflect far-infrared rays well, and so they are indicated in dark red. On the other hand, as plants that grow fast reflect a greater number of far-infrared rays, they are shown in bright red. Water is expressed in either black or blue, and urban areas in silver (or white). The typical example of false colors include those consisting of infrared wavelength, such as the ones allocated with near-infrared (R), red (G) and green (B), and those allocated with short-wavelength infrared (R), near-infrared (G) and green (B). Depending on the reflection characteristics of an object, it is possible to create false-color images with different appearances.
| Name |
Wavelength band |
Description |
|---|---|---|
| Visible light | 0.4-0.75 μm |
A wavelength band that is utilized in many observation satellites The band from 0.4 to 0.446 μm is violet. The band from 0.446 to 0.500 μm is blue. The band from 0.500 to 0.578 μm is green. The band from 0.578 to 0.592 μm is yellow. The band from 0.592 to 0.620 μm is orange. The band from 0.620 to 0.7 μm is red. The blue, green, and red are called the three primary colors and are the base of color mixing. |
| Near-Infrared (NIR) | 0.75-1.5 μm | Each of the ice crystals in the clouds, the condition of the earth’s surface, etc. have unique reflection properties. The visible, infrared, and mid-infrared ranges are used heavily in satellites. |
| Mid-infrared (MIR) | 1.5-5 μm | It is used in atmospheric observations such as detecting and classifying clouds. As for land surface observation, it is used in monitoring volcanic activity, detecting heat sources like wildfires, and measuring oceans’ surface temperature. |
| Thermal infrated (TIR) | 5.0-15.0 μm | Like the mid-infrared, it is useful in detecting heat sources. It is also used in observing changes to the ice cover. |
| Microwaves | 1mm-1m | It enables observation that is not affected by the weather as the waves penetrate the clouds. Microwaves have passive and active types, where the passive microwaves are useful in observing the weak electromagnetic waves emitted by water particles in the air and on the earth’s surface. Whereas for the active microwaves, the satellite itself releases energy and detects the electromagnetic waves reflected from the target. |
Visible light range 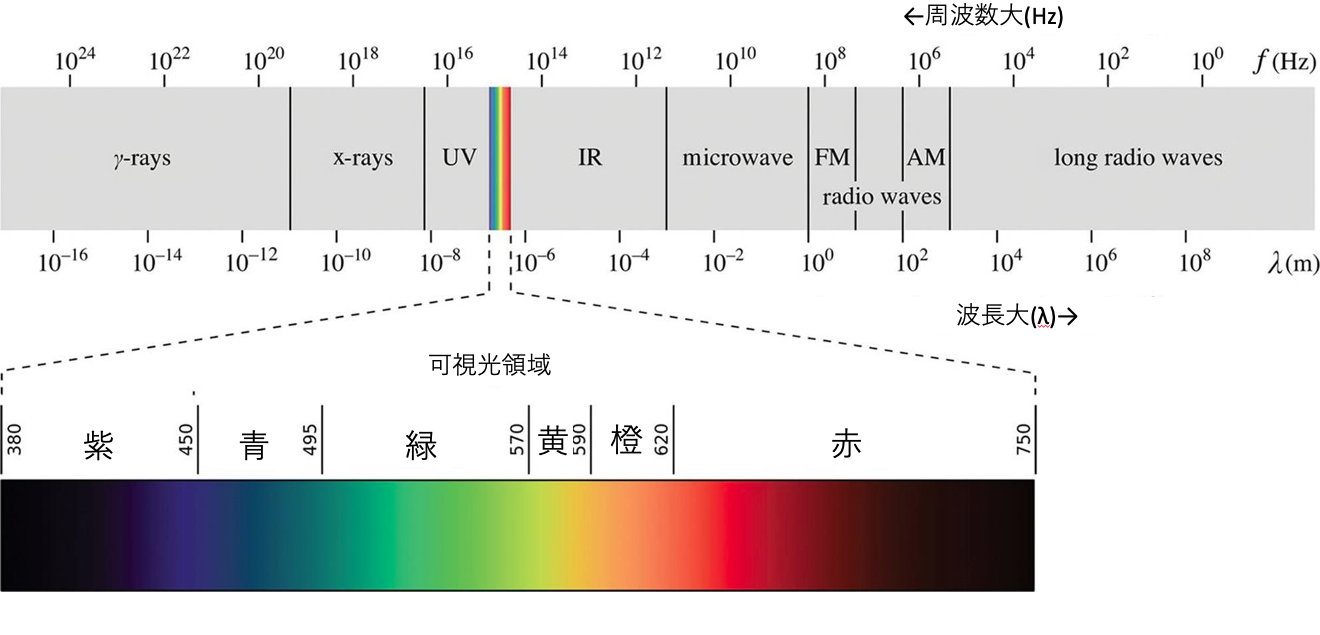
Water absorbs most of the blue color wavelength (from 450 to 490 nm). This wavelength can be used to observe the characteristics of water surfaces and extract shallow areas of oceans and lakes. Artificial objects on the roads and in cities can be well captured with blue light. The reason why we see the sky as blue is that the blue color wavelengths scatter due to the gaseous molecules in the air (see Rayleigh scattering for more details)
Green light (from 490 nm to 580 nm) is useful in observing plants and phytoplankton. That is because the chlorophyll inside such organisms absorbs the wavelengths of red and blue and reflects green. Likewise, water sediments are known to also reflect green. The layer of sand and mud in the water reflects the wavelengths of both green and blue, which makes it display as more vibrant than other objects.
The red wavelength (from 620 nm to 780 nm) helps identify minerals and soil. For example, in the above image, the soil is represented as light brown to dark brown (slightly leaning towards orange) This change in color is due to the effect of the soil’s mineral content. Moreover, chlorophyll absorbs the red color, thus it is also used for monitoring the growth progress of plants (including crops). The red color wavelength is not suitable for precise identification, but it can be used in classifying plants.
Infrared range
Infrared rays can be classified into wavelengths from those close to the visible range, through near-infrared, mid-infrared, to thermal infrared. Based on the sample, the short-wavelength between near-infrared and mid-infrared can be defined. In addition, the classification varies so that the wavelength after mid-infrared becomes far infrared, etc.
The near-infrared rays (NIR) include the wavelength range from 700 nm to 1,100 nm. Water absorbs the near-infrared well, thus it is utilized to identify water from land when it is difficult to do so with the visible region. For example, in the figure above, the riverbed and wetland (the upper right corner of the graph) are represented in a darker color than the surrounding dry land, which indicates the presence of water there. In contrast, plants strongly reflect the near-infrared, especially if the plant is really strong, then the phenomenon becomes more evident. This wavelength penetrates dust particles in the air, which makes it suitable for capturing more details of hazy images.
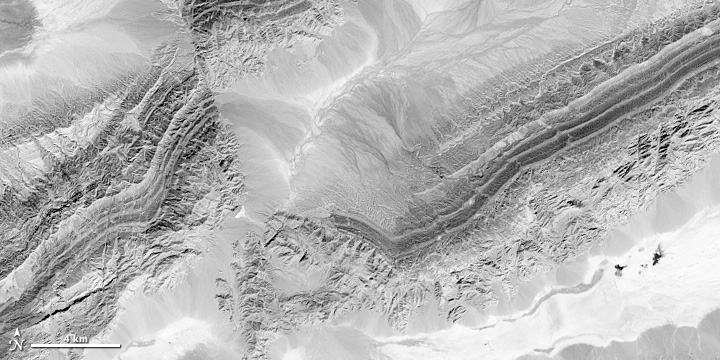
The short wave infrared (SWIR) range is from 1,100 nm to 3,000 nm. Water absorbs shortwave infrared well for the 1,400 nm, 1,900 nm, and 2,400 nm bands. For example, even underground, the water content is represented as shades from light to dark. In other words, SWIR is useful for determining the water content of soil or plants. Not only can we use SWIR to identify cloud types but also it can help differentiate clouds from snow, which simply appear white when captured with visible light. Besides, SWIR is very sensitive to heat and it is reflected even stronger from lands where there is combustion. One of the applications for this characteristic is to determine the damage range during a fire. Rocks have different reflection properties relative to the mineral content in each type; this is another aspect that SWIR can be used to observe. The figure below is an image of a mountainous region comprised of sandstone and limestone captured with SWIR. Each rock is displayed in a different color tone relative to its mineral content
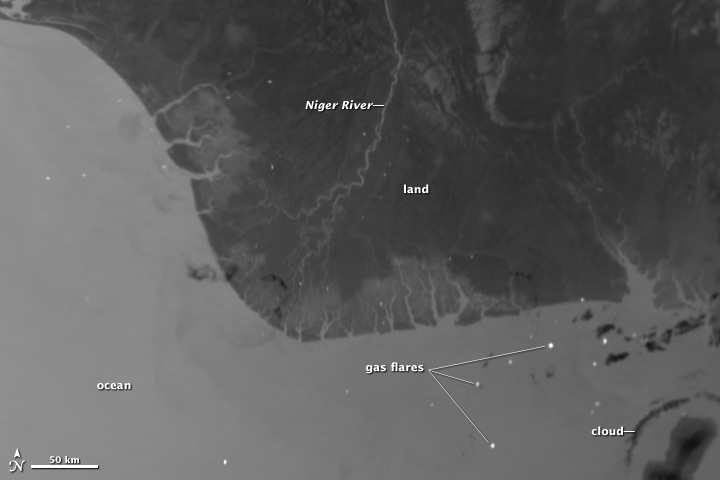
The mid-infrared range (MIR) is from 3,000 nm to 5,000 nm and it is mainly used to observe thermal radiation during the night. This wavelength is used to inspect the surface temperatures of oceans, clouds, and fires. The image below is the observation of the same spot during the night with wavelengths of the visible light region (top) and the mid-infrared region. In the first image (top), only the reflected or radiated light was observed. On the other hand, in the second image (bottom), the clouds and the ground, which had cooled down during the night, are displayed in dark tones while the comparatively warm oceans and rivers are displayed in bright tones.
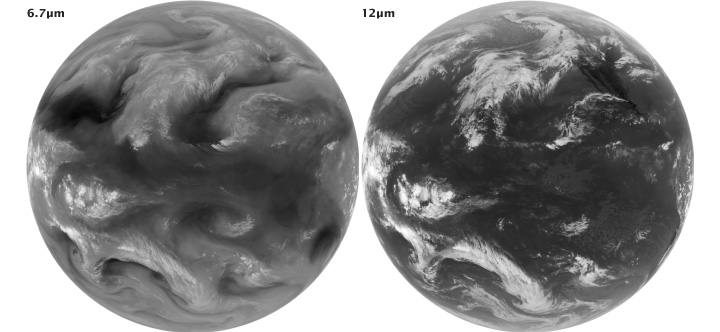
The region from 6,000 nm to 7,000 nm is utilized for observing atmospheric water vapor. Water vapor comprises only about 1 to 4% of the atmosphere but it is one of the important greenhouse gases. Thanks to its properties, it is considered to provide indispensable information for meteorological observations and predictions. The bottom image shows the water vapor content (left) and the atmospheric temperature (right) by using this region and thermal infrared.
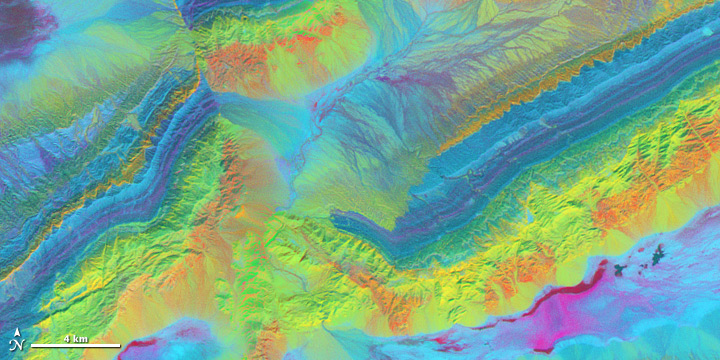
Thermal infrared or long-wave infrared (LWIR) covers the wavelengths ranging from 8,000 nm to 15,000 nm. This wavelength is radiated by the earth in the form of heat. This wavelength is utilized in capturing objects that radiate heat such as capturing water, the temperature of the earth’s surface, the Mapping of terrestrial heat and fires. The image below is a comparison of the same spot between a satellite image captured by SWIR and another image captured with TIR. Compared to the left image (SWIR), the image on the right (TIR) has captured the rocks better. Additionally, by taking advantage of how plants release water vapor into the atmosphere through transpiration making the air above that area cooler, it can be utilized in investigating how much water was used by plants.

Microwaves range
In microwave remote sensing, there is a passive type and an active type. Microwaves range from wavelengths of about 1 cm to 1 m. Compared to visible light and infrared, it has a long wavelength, therefore even when the ground is difficult to capture due to clouds and dust in the air, it can penetrate them and allow us to observe the ground. The reason is that, unlike short wavelengths, microwaves are not affected by the scattering in the atmosphere. Microwaves have the advantage that it can be used to collect data regardless of the weather condition and the time of day.
1.3 Interaction with the atmosphere
The earth is wrapped by a layer of atmosphere. It is composed of various molecules with oxygen and nitrogen at its core, and it is called the atmosphere or the air. It contains not only gaseous molecules, but also minute particles such as water vapor, ice crystals, and dust; it also contains bacteria. The sunlight goes through the atmosphere, where, in theory, it is obstructed and gets distorted from its original path. This phenomenon is called scattering.
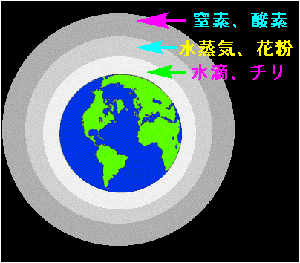
Technically, the interaction between light and minute particles is defined as scattering; The amount of scattering is calculated with the wavelength of the light (λ) and the size of minute particles (d). When the minute particles’ size is sufficiently smaller than the light’s wavelength (λ << d), Rayleigh scattering occurs and it is inversely proportional to the fourth power of the wavelength. Strictly speaking, if the light’s wavelength is bigger than the particle it will not reflect the light. However, because of the polarity of gaseous molecules, it affects the light (light is an electromagnetic wave). Nitrogen and oxygen molecules scatter blue light and the scattered light is further scattered repeatedly (Multiple scattering) rendering the whole sky blue. That is the reason we see the sky as blue.
Likewise, Rayleigh scattering can also explain the reason why the sky becomes red. Sunlight in the daytime comes directly from above and the atmosphere layer it travels through is a short distance but in the dusk, it travels through it diagonally, which makes the atmosphere layer it goes through a longer distance. The blue light is mostly scattered in the process and only a small part of it manages to reach the earth. On the other hand, red light does not scatter much and the amount that reaches the earth is large, in comparison. This is what causes the sunset.
Water drops among atmospheric particles are quite large and it is known that snow is a group of water drops. Water drops are considered as either the same size or larger than the wavelength of light. The scattering that occurs as a result of such particles is called Mie scattering. In this type of scattering, the wavelengths of visible light are scattered at the same level, therefore, the objects look white. The same principles apply in hot springs, where some murky white types can be observed.
Non-selective scattering occurs when the particles in the atmosphere are much larger than the wavelength of radiation. Like Mie scattering, all the wavelengths of visible light are scattered at the same level, therefore, the objects look white. The dust particles in the air are a good example. This scattering includes the infrared. When the sunlight hides behind a cloud, we can no longer feel its warmth. This is because non-selective scattering occurs and makes the wavelengths that make us feel warm difficult to reach us.
1.4 Reflection and radiation (Interaction with the subject)
Reflection
When light hits the subject surface, it absorbs some of it and the light that was not absorbed is divided into light that is reflected by the subject and light that penetrates it. The satellites recognize the light reflected from the subject separately by each wavelength. Subjects will vary in how easy it can reflect or absorb a certain wavelength.
Radiation
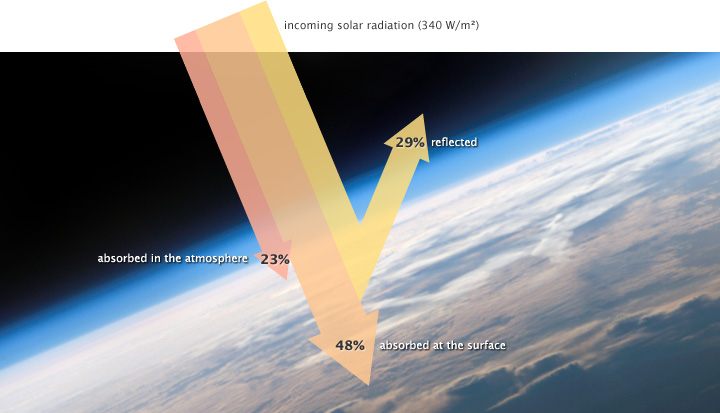
Energy is radiated from light sources such as the sun but not all of it necessarily reaches the earth. For example, energy from the sun that reaches the earth is about a half. Because the dust in the air and the bright surfaces (snow and ice) reflect it while water vapor and dust in the air, as well as the ozone, absorb it.
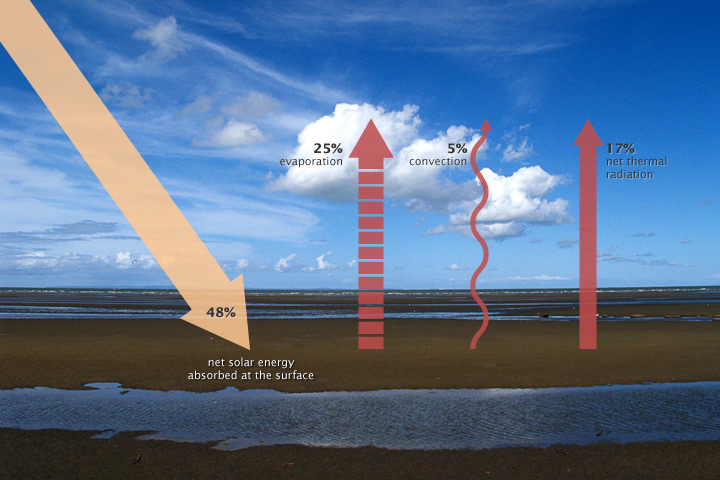
The earth’s surface loses the energy that reaches it due to the effect of evaporation, convection, radiation of the thermal infrared. The radiated thermal infrared energy is absorbed in the atmosphere, but most of it goes through outside the earth. Satellites can observe the energy radiated from the earth’s surface. In case the radiated energy is not sufficient, the satellite sensors cannot capture it.
1.5 Passive and active observation
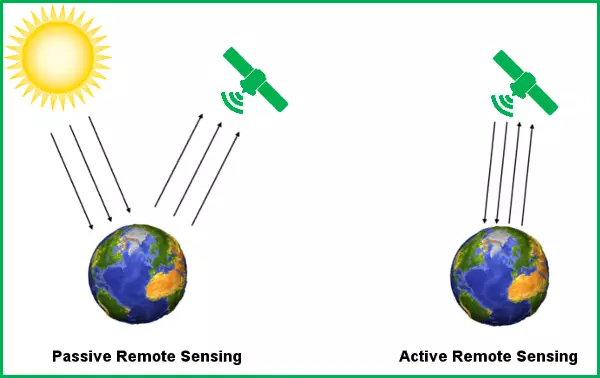
The satellites that observe subjects, which reflect or radiate the energy released from light or energy sources, use passive sensors. Reflections can only be utilized when the sunlight is hitting the subject. The caveat for utilizing radiation is that there must be sufficient energy released by the subject so that the sensor can capture it.
On the other hand, active sensors release the energy required to make the observation. The released energy is reflected by the subject and then detected by the sensor. The advantage of this sensor is that it can be utilized either at noon or at night. The active sensor is used regardless of the time of day, thus it uses wavelengths close to microwaves. As for its weak point, it requires a large amount of energy to illuminate its subject, requires a special sensor, and the interpretation of the acquired data is difficult.
1.6 What is an image?
Satellite images are created based on data acquired by man-made satellites. Satellite images are obtained when the sensor independently collects data based on a certain wavelength band, thus it is possible to interpret a combination of wavelengths according to the purpose. We will skip the details about processing the acquired data and converting it to an image, but the processed images are saved in formats such as HDF and Geo TIFF. Recently, it has become popular to use the format, Cloud Optimized Geo TIFF (COG).
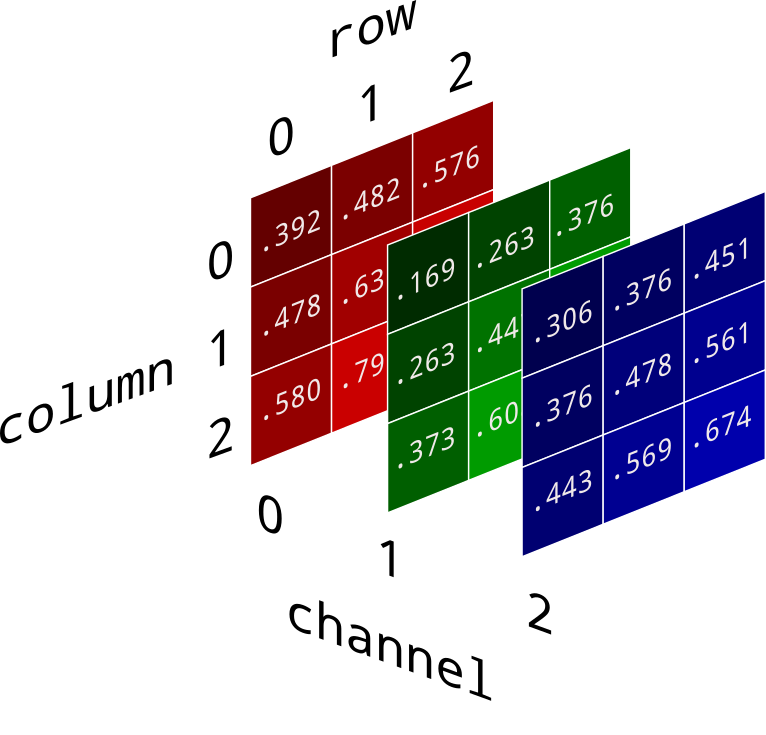
The image data are constructed with pixels, which are a collection of squares separated with equal divisions. Information on the image luminance or color tone is distributed on each cell as numerical data. Satellites’ sensors detect electromagnetic waves and record the numerical information in an array, and then it can be utilized to process the image (displaying the data as luminance and bright or dark color tones).
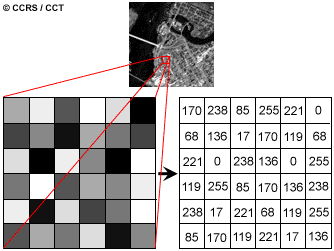
The above image is an 8-bit grayscale image, thus the values range from 0 to 255. For color images, Higher-Dimensional Arrays must be used (each of the RGB values need be distributed). In the below image the RGB values are distributed over 9 pixels. This is how the digital data is converted from numerical values and forms a color image by displaying each color tone.
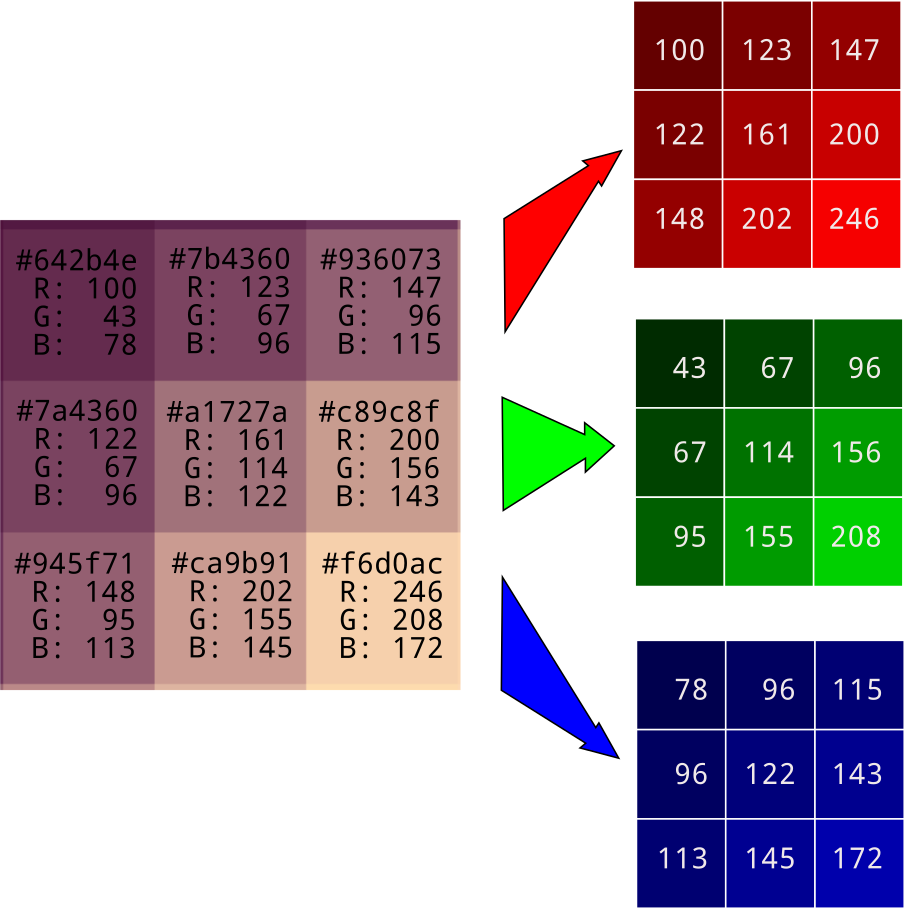
Source:https://brohrer.github.io/images_to_numbers.html
The RGB values are saved in separate layers (three-dimensional (3D) array). When processing the data with programming languages, it is important to understand that the data is distributed in Higher-Dimensional Array.
Knowledge about digital images is extremely valuable for displaying the data acquired through remote sensing and processing it into an image. The values of each wavelength captured by the sensor are distributed to RGB cells and become an image. For the satellite images, which hold information of multiple wavelengths, it is possible to choose a particular wavelength to build the image with, after considering the subject’s reflective properties, which makes emphasizing the subject according to the research’s purpose a flexible process. Regarding the interpretation, please refer to the image interpretation tutorial.
1.7 Coordinates, map projection techniques, and geodetic system
This section will explain first what coordinates are. We will start with the familiar XY coordinates and progress to geographic coordinates, plane coordinates (right-angled), to UTM (Universal Transverse Mercator) coordinate system. Then we will elaborate on actual map projection techniques; finally, we will explain the geodetic system. Through the explanation, you will be able to understand how satellite images are projected on a 2-dimensional surface.
Coordinates
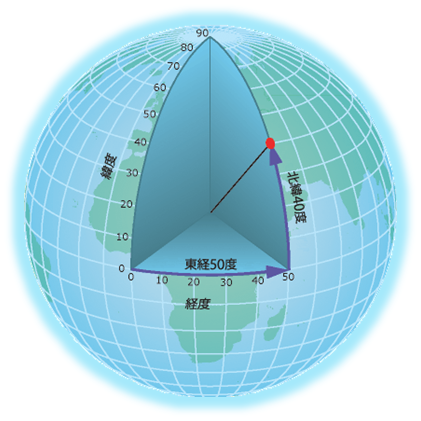
The coordinates must be fixed in order to know where a certain place on earth is located. The Cartesian coordinate system is the most well-known coordinate system. The Cartesian coordinate system can identify where a certain spot is on the X and Y axes where the starting point is at the center. However, this is system is insufficient for defining locations on earth. Therefore, a different coordinate system, the geographic coordinate system is used to define the location of a certain spot on the earth.
Source:https://www.esrij.com/gis-guide/coordinate-and-spatial/coordinate-system/
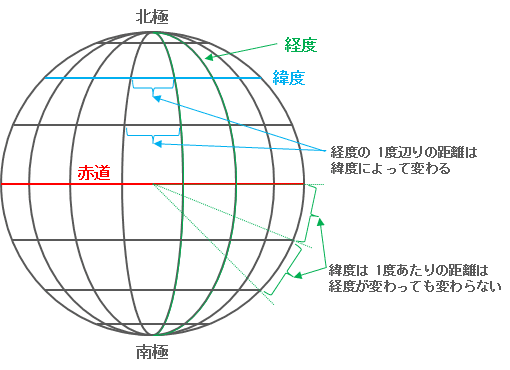
As seen in the above image, the geographic coordinate system does not define locations in 2-dimensional space as in the Cartesian coordinate system. Instead, it references locations to the latitude, a scale from north to south (it defines the north pole as an angle of 90°N, the south pole as 90°S, and the equator as 0°), and the circle of latitude, with which it intersects, runs from north to south. The longitude is a scale from east to west (it defines the east as 180°, the west as 180°, and the prime meridian as 0°), and the intersection point is the meridian. The longitude, unlike the latitude, does not run in parallel and the interval distances between longitude lines get shorter as the latitude lines go higher. Specifically, the distance at the equator is 111 km but close to the earth poles, it becomes close to zero.
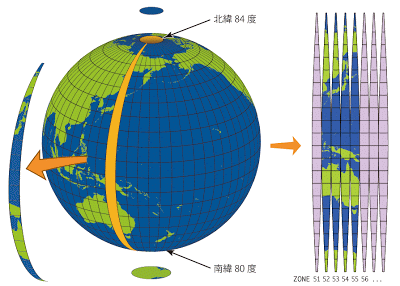
The UTM coordinate system divides the earth into 60 divisions; it is easier to understand if you think that it is what connects them all. Each division is called a zone and is 6° of longitude in width. The zones are large in the center and get smaller with higher latitudes (see the above image).
Unlike the geographic coordinate system, it divides each zone into halves of north and south with the equator as the center; both the north and the south have a point of origin and the XY coordinates are defined from each point of origin. In other words, to locate a position with UTM, we must know 4 parameters, the zone, whether it's north or south, the X coordinate, and the Y coordinate.
Map projection
Map projection is used when converting geographical coordinates into two-dimensional ones. Let us review the elements of geographical coordinates:
- Angular: the unit in coordinates for locating an object when the earth is considered as a spheroid.
- Spheroid: Which spheroid (earth ellipsoid) should be used.
- Origin and datums: geometric standards for locating an object on the set spheroid
- Prime meridian: Meridian standard in a set datum
In geographical coordinates, a three-dimensional earth is digitized, and the location of an object is indicated. In map projection, the three-dimensional information is converted into two-dimensional one. There are three major projection methods.
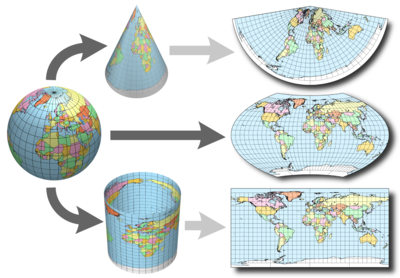
-
Conic projection: The projection seats a cone over the sphere of the earth, and the cone is unrolled.
-
Azimuthal projection: The grid of a spheroid is projected onto a flat surface.
-
Cylindrical projection: The earth is wrapped with a cylinder, and the earth’s surface is projected onto the cylinder, and it is unrolled.
It can be understood that the shape of a circle is distorted, as it gets away from the center of the figure.
Source:https://www.esrij.com/gis-guide/coordinate-and-spatial/coordinate-system/
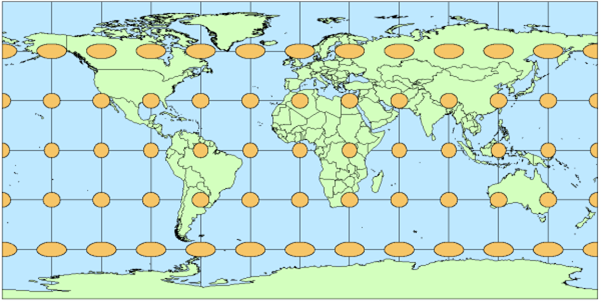
In geographical coordinates, all regions can be managed with a certain yardstick. Complex calculation is required, but it is possible to locate an object accurately on the surface of the earth. On the other hand, if geographical coordinates are projected onto a flat surface, distance, area, and angle will be distorted. In the figure below, circles with the same size drawn on the spherical surface of the earth are projected onto a two-dimensional surface. It can be understood that the circles are deformed according to places and shapes cannot be depicted accurately.
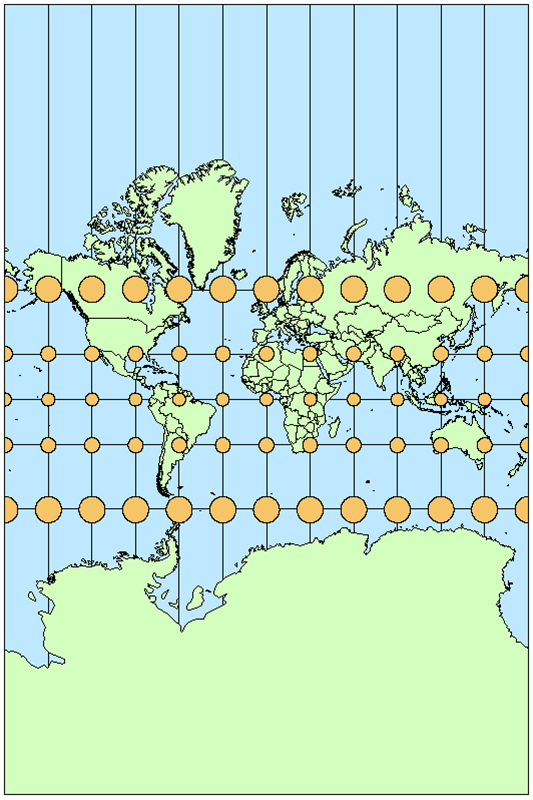
None of projection methods can prevent geometrical distortion, but some geometrical properties can be maintained according to projection methods (It can be said that properties to be maintained are selected according to purposes). In the figure below, the Mercator projection, which is one of conformal projection methods, is used. At any spot, a circle is not distorted, and the angles of the earth’s surface are represented accurately (while areas are distorted). It can be understood that it is necessary to choose a projection method according to what property you want to express accurately.
Datum
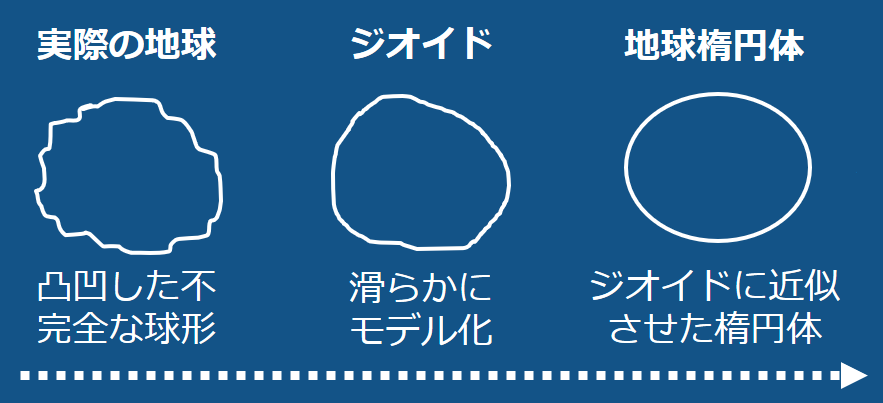
Lastly, let us explain a datum. In order to represent the locational information on the earth on a flat surface, it is necessary to use a projection method. Above all, how can the earth be considered as an ideal ellipsoid? As shown in the figure below, the earth’s surface is rugged. Accordingly, it is impossible to define locational information accurately without modification.
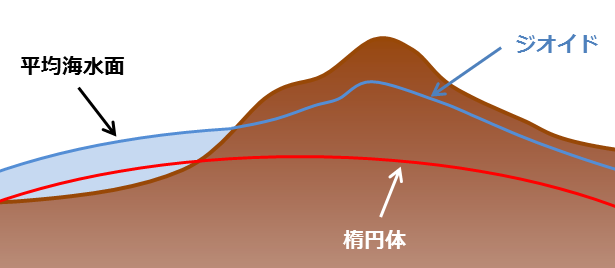
Therefore, it is necessary to define the earth as an ideal ellipsoid centered around the origin. The ellipsoid is superimposed on a model called a geoid (surface based on the average sea level), which simplified the shape of the earth. By following this rule, it is possible to depict any place on the earth with the locations on a smooth ellipsoid.
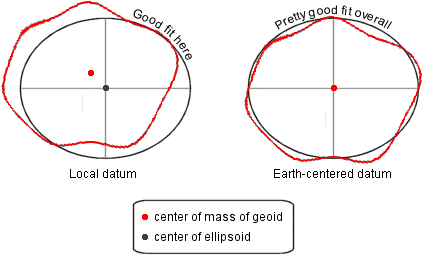
A datum specifies a system for choosing an ellipsoid for a geoid. As shown in the figure below, it is possible to define an ellipsoid that fits a specific region or an ellipsoid that fits all regions to some degree. The former is called a local datum, while the latter is called a global datum. They are different in the location of the origin of an ellipsoid. For a global datum, Cartesian geocentric coordinates, in which the origin of an ellipsoid is located at the center of gravity of the earth, are applied (The location of the origin varies significantly between the right and left figures below.)
Like this, with various methods, the geographical information of the “elliptic” earth is represented on a flat surface. In order to display satellite images at corresponding locations on a map, it is necessary to place the satellite images on a flat surface with the totally same method as the map projection. With the GIS application, these pieces of information can be handled as the coordinates reference system (CRS). It is important to grasp the datum used for assuming the earth as an ideal ellipsoid and the projection method used for reflecting the information on geographical coordinates in a flat surface.
1.8 Map tiles
Like the data distributed by Tellus, satellite images are sometimes used as tile-shaped images on a website. A map constituted by these tiles is defined by tile coordinates, which are for displaying satellite images efficiently on a website.
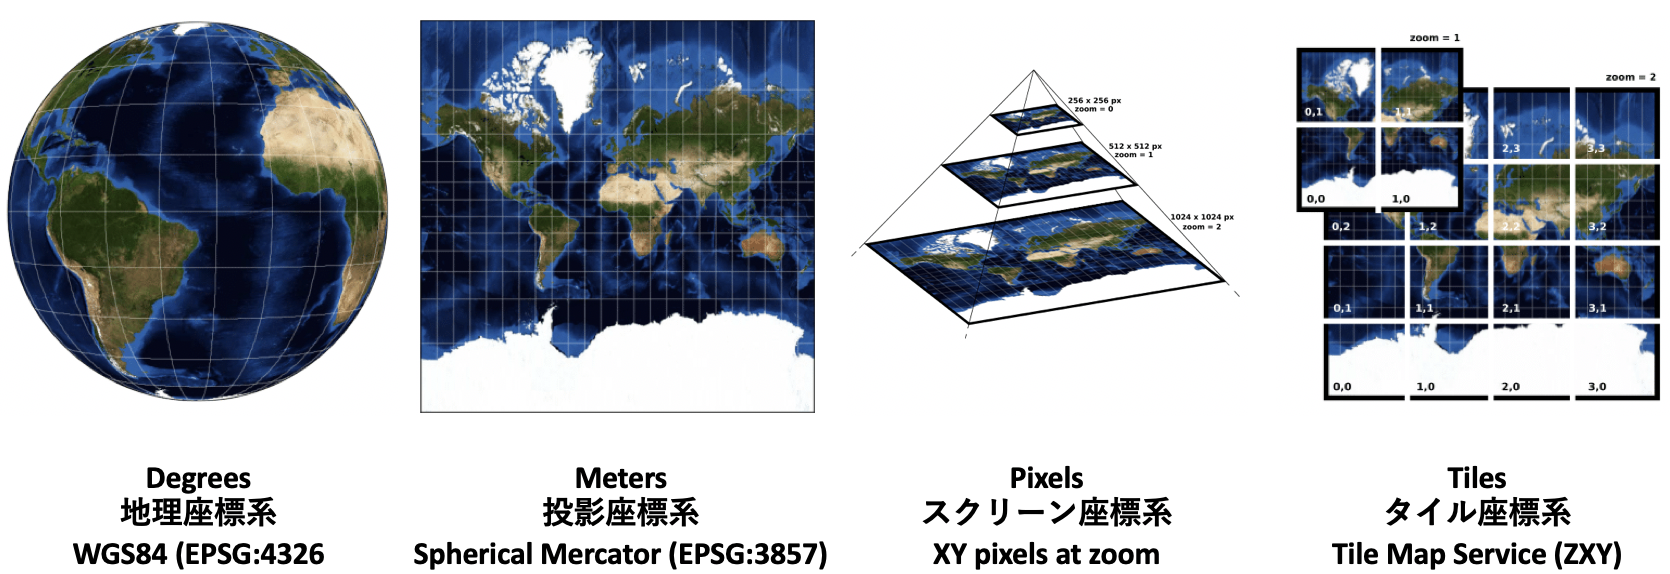
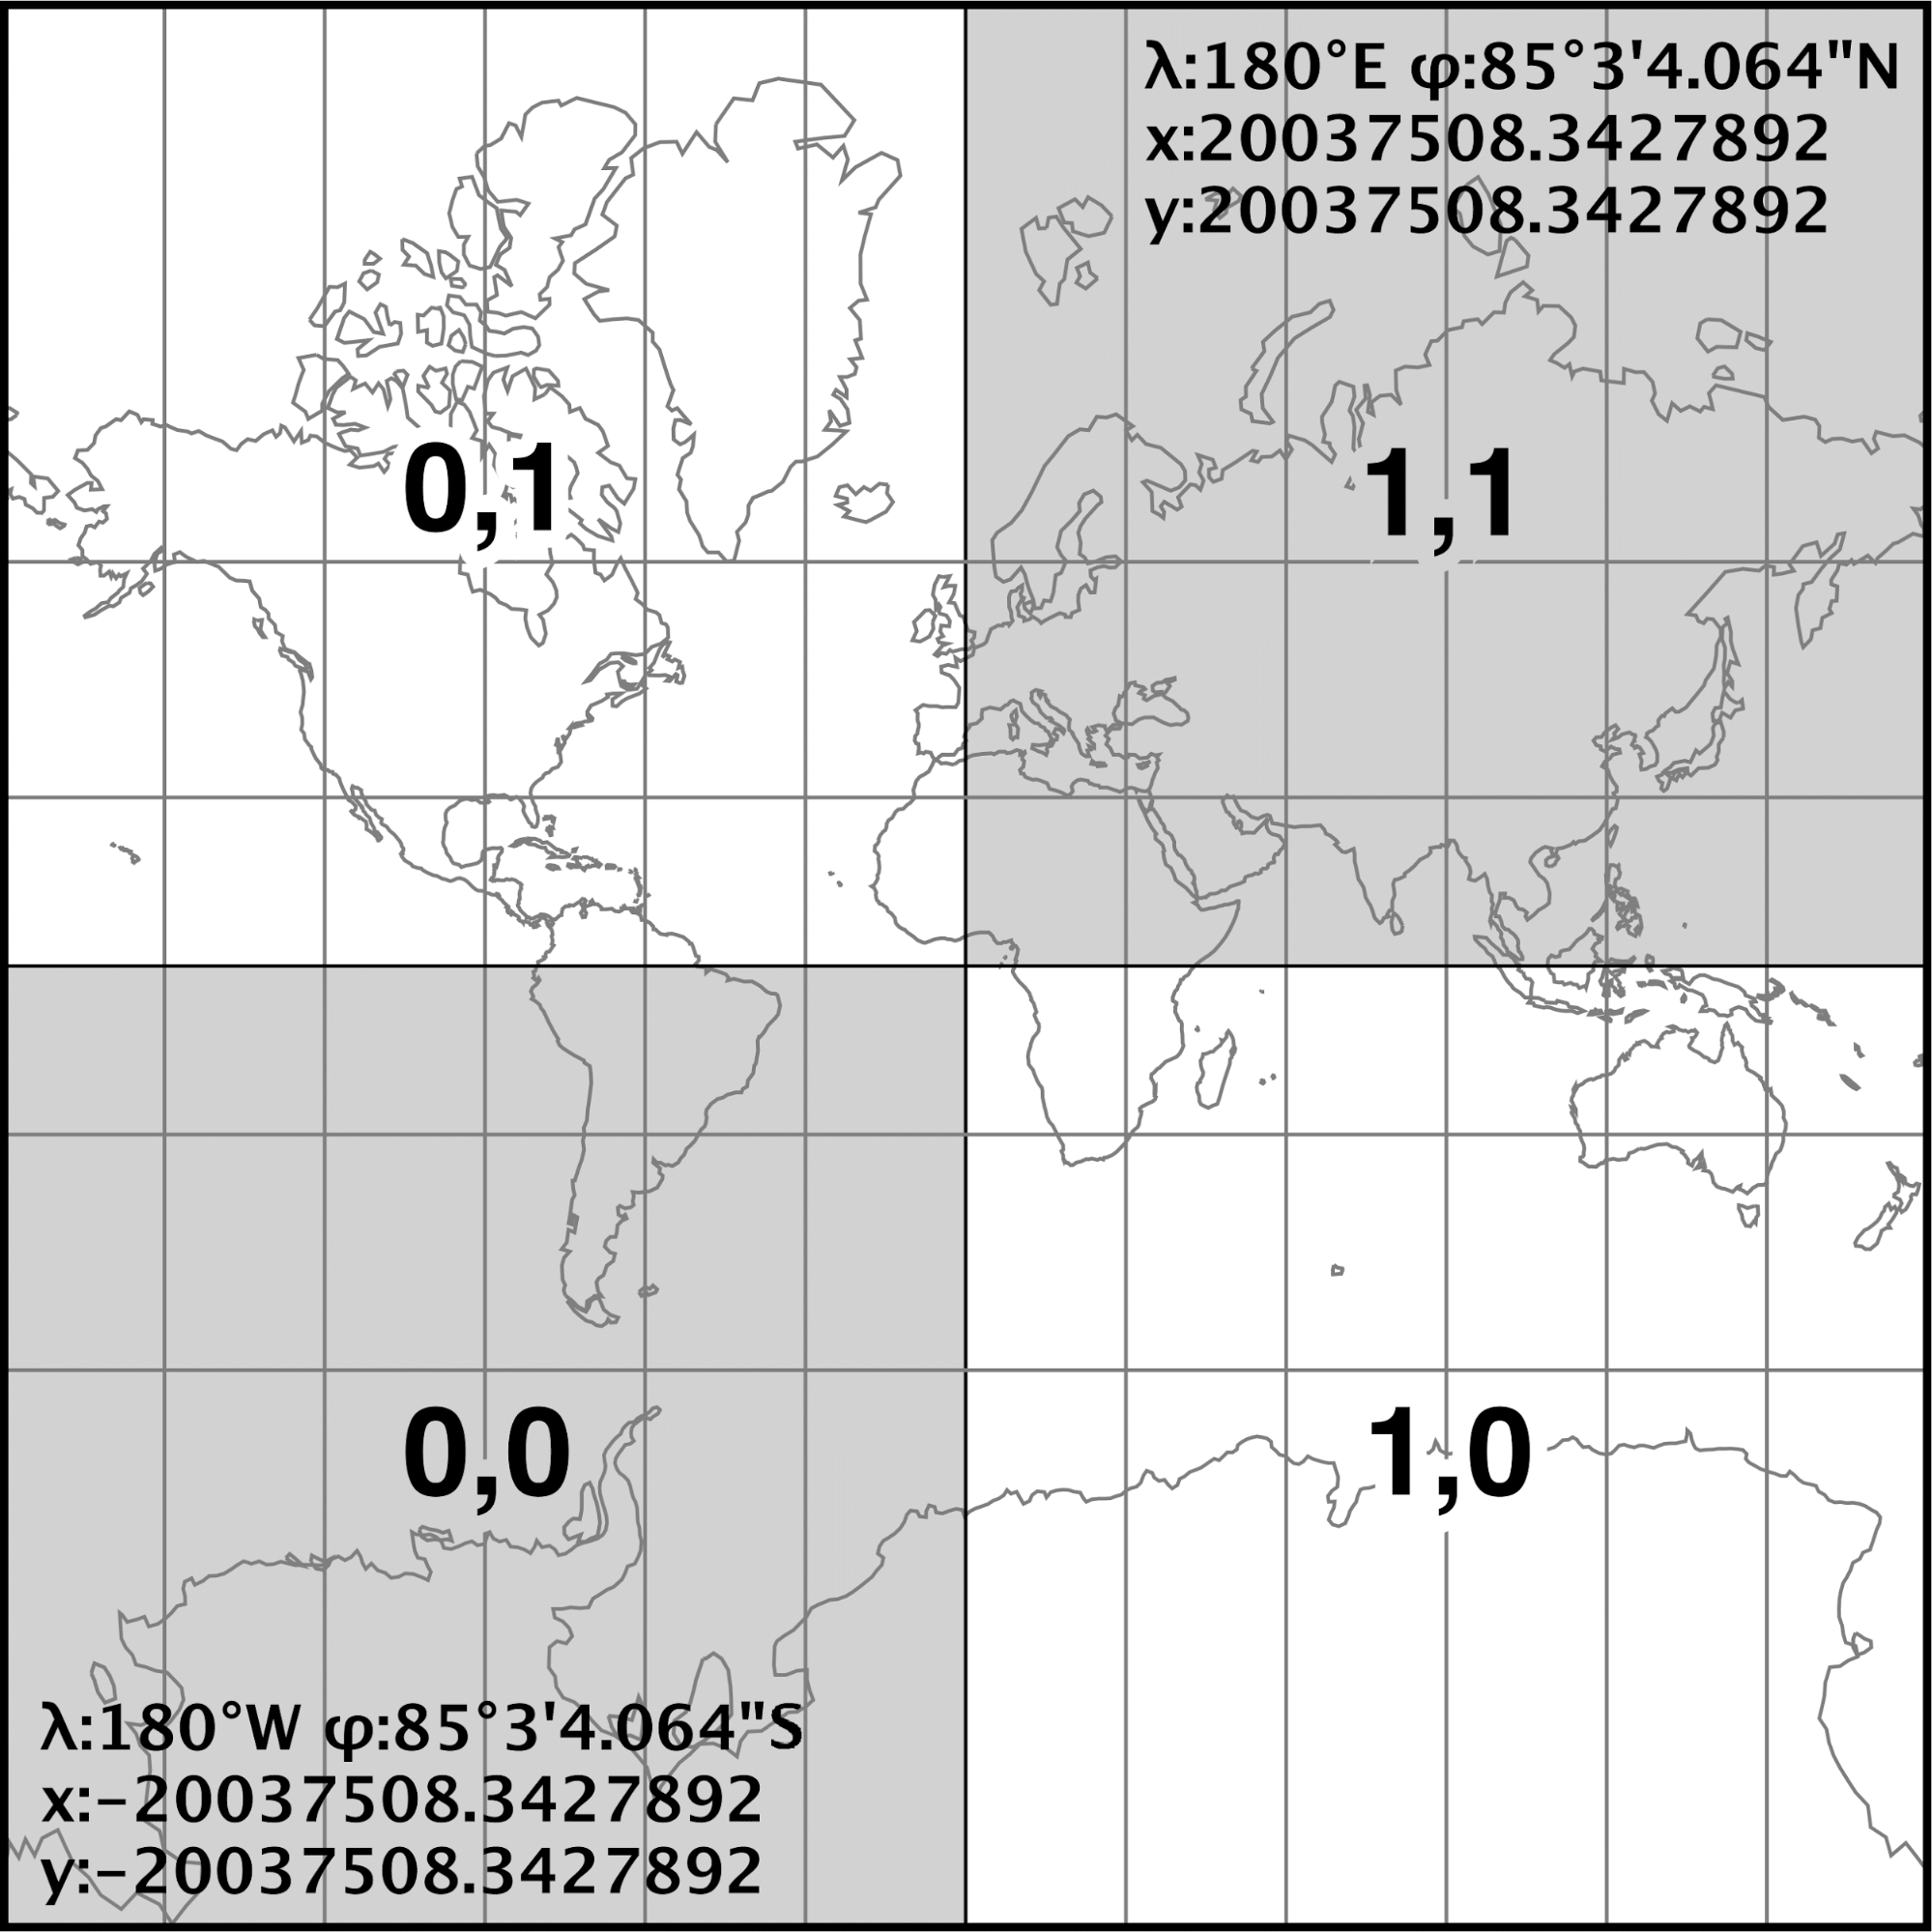
In tile coordinates, the origin is located at the upper left or lower left of the window, and the x-axis extends in the right direction while the y-axis extends in the upward direction in the window. 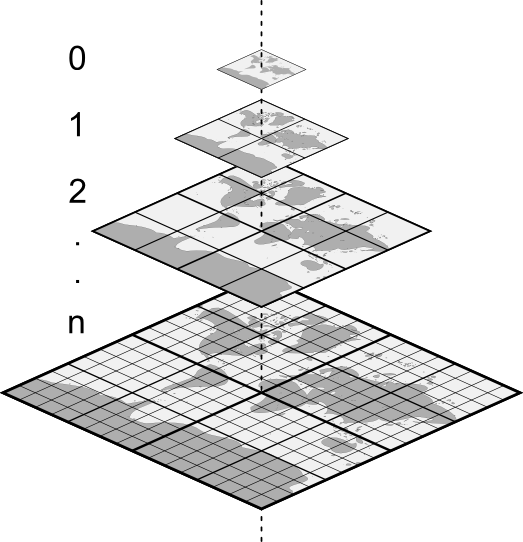
As shown in the above figure, the number of tiles on a plane increases according to the zoom level (2^(zoom×2)). When a 256×256 square projecting the entire earth is used, the zoom level is 0. When that plane is divided into 4, the zoom level is 1 (the size of each tile remains 256×256). For each tile, the tile coordinates constituted by the x-axis and the y-axis are defined. The tile whose endpoint is at 180 degrees west longitude and about 85.34064 south latitude is located at (X,Y) = (0,0), and the eastward direction is the positive x direction while the northward direction is the positive y direction. In Open Street Map (OMS), the tile’s (0,0) is located to northwest, and the x-axis extends in the eastward direction, but the y-axis extends in the southward direction.
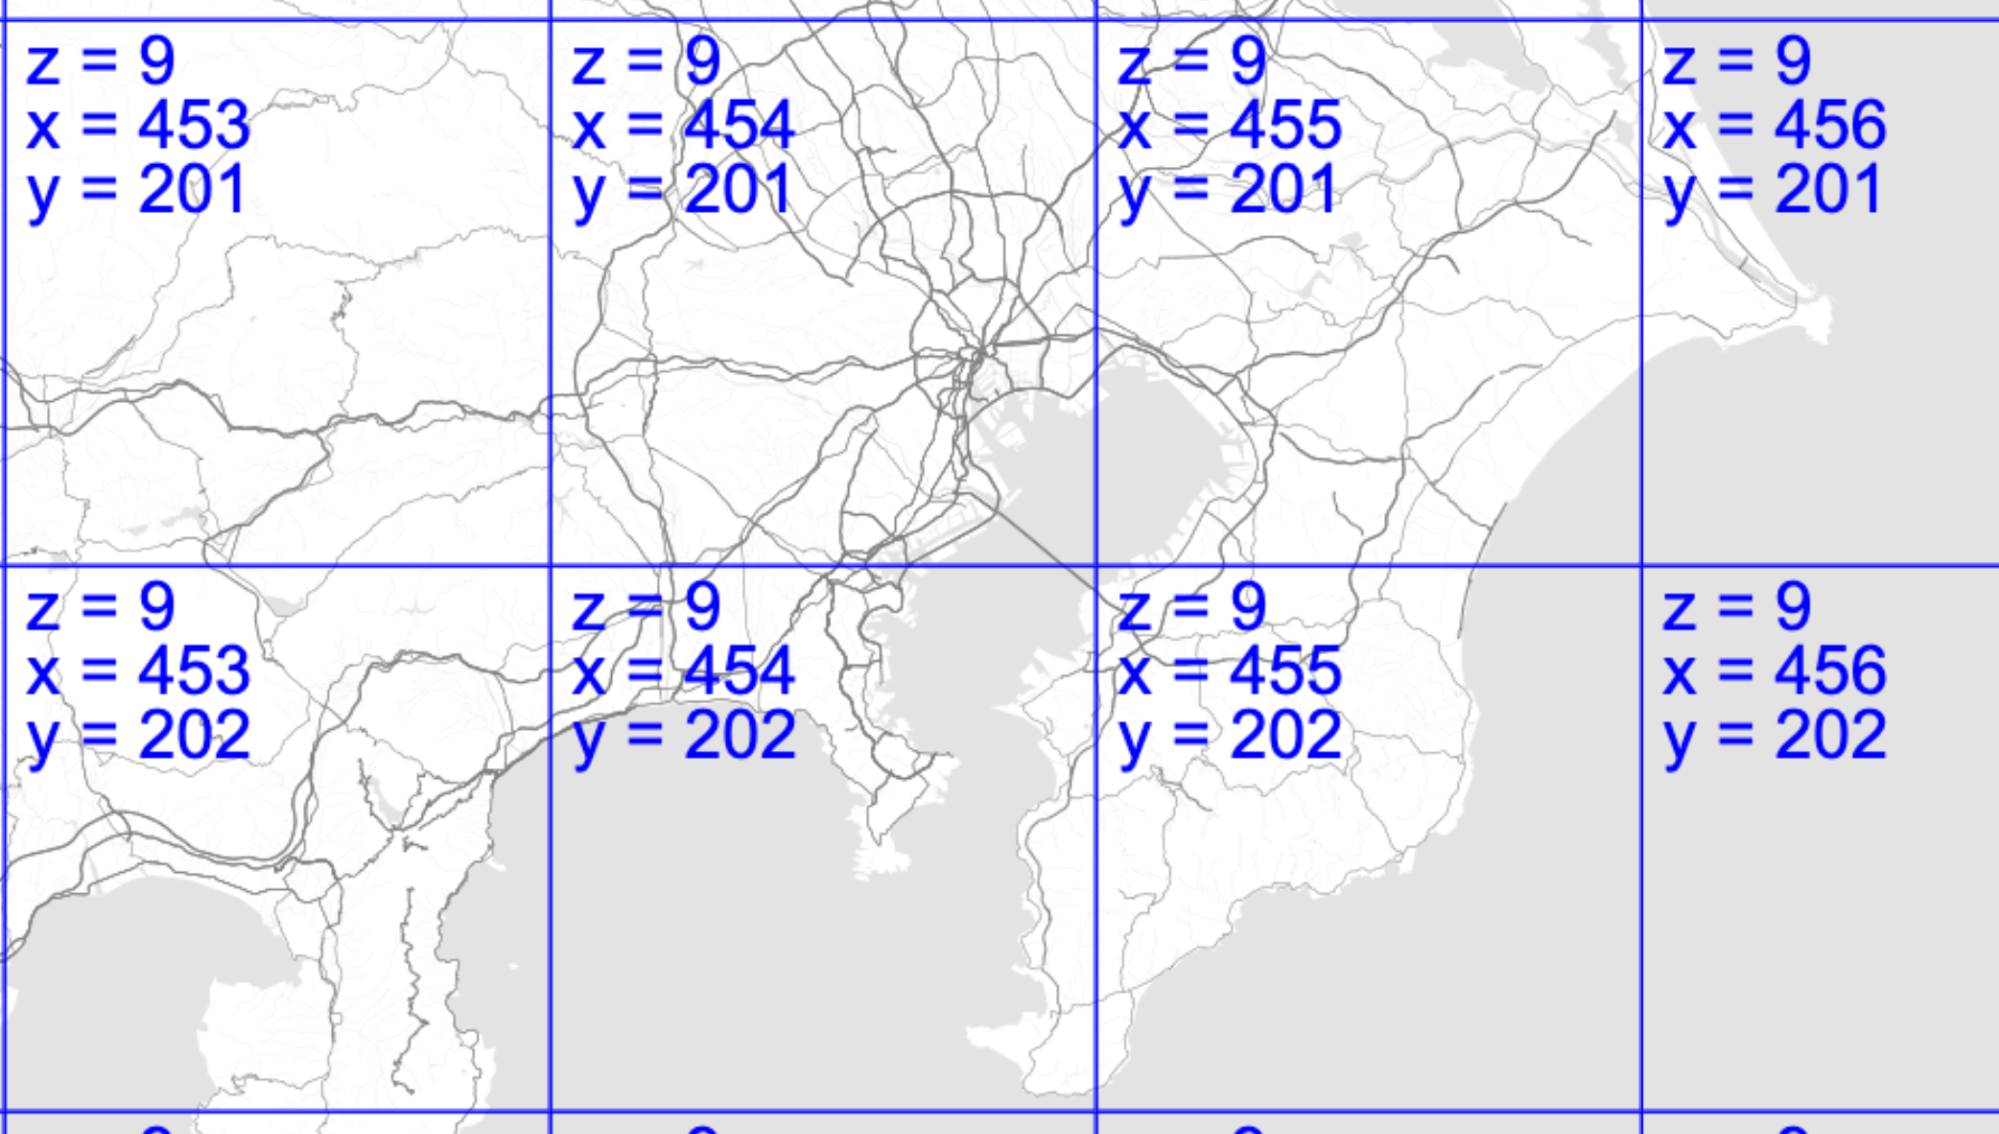
The figure shows the map tiles on Tellus OS. OMS is used for Tellus, so map tiles follow OMS. It can be understood that the positive x direction is eastward, while the positive y direction is southward.
References
- Characteristics of Images | Natural Resources Canada
- How to Convert a Picture to Numbers
- Know Basics of Remote Sensing Quickly and Become Expert
- Why is that Forest Red and that Cloud Blue? How to Interpret a False-Color Satellite Image
- What is the wavelength of light? Why can an artificial satellite see things that cannot be seen by the human eye?
- Meteorological Satellite Center | Characteristics of near-infrared images
- Exploring the middle infrared region for urban remote sensing: seasonal and view angle effects
- https://www.cambridge.org/core/journals/journal-of-glaciology/article/applications-of-satellite-thermal-infrared-images-for-monitoring-north-water-during-the-periods-of-polar-darkness/883E067C02921D1B68855F08B616D5A5/core-reader
- A Review: Remote Sensing Sensors
- I want to know more! Basics of thermo-fluid analysis 37, Chapter 4 Heat transfer: 4.6.3 Reflection, absorption, and transmission
- Q&A
- Electromagnetic Radiation | Natural Resources Canada
- https://www.esrij.com/gis-guide/coordinate-and-spatial/coordinate-system/
- https://www.earthdatascience.org/courses/earth-analytics/spatial-data-r/intro-to-coordinate-reference-systems/
- Hiroshi Masaharu (2011), Map projection
- https://www.e-education.psu.edu/geog260/node/1912